
 Language: English | Duration: 30 minutes
They say seeing is believing. Visualizations have the power to persuade, communicate your findings, and show-off your achievements, but creating the right one can quite a bit of time and energy—until now.
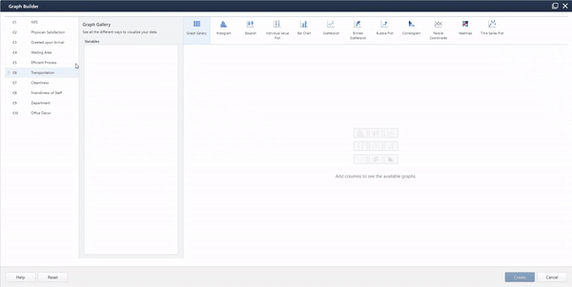
Meet Graph Builder, our new tool to instantly visualize, create, and explore your insights.
With its interactive and easy-to-browse gallery, Graph Builder lets you seamlessly switch from one graph to the next using the same data and without re-running your analysis, so you can focus on choosing the right visual for your needs.
Ready to see Graph Builder in action? Watch our on-demand webinar presented by Minitab Expert Jenn Atlas, Global Market Development Manager, as she showcases Graph Builder's capabilities in the latest release of Minitab Statistical Software with a few exciting and inspiring use cases.
|
|
Jennifer AtlasGlobal Market Development Manager, Minitab LLC
|
|
Jennifer Atlas studies how organizations solve analytical problems and works with product development to ensure that Minitab delivers on our commitment to make data analytics easier. As a classically trained statistician, Jenn has worked, trained and consulted in the field of analytics for over 25 years. |
|

Further Information & Resources
Interested in learning more on the latest release of Minitab Statistical Software? View What's New.
Looking for additional webinars? View our Events Page to see everything upcoming and on-demand.