What’s Holding Your Initiatives Back?
-
Scattered Data: Teams waste time searching for information instead of improving processes.
-
Unmeasured Results: Without tracking progress, success is impossible to prove or sustain.
-
Lost Impact: Great ideas fade when outcomes aren’t captured or shared.
You need one platform to connect every project, metric, and outcome.
Centralization
Savings Tracking
ROI Visualization
Workload Optimization
-
Too many CI projects go unmeasured, making it difficult to demonstrate real impact. You can’t showcase improvement if you can’t see it.
KYOCERA's Implementation of Minitab Engage on a Global Scale
WEBINAR
Maxion Wheels Accelerating Savings Through Continuous Improvement
CASE STUDY
Due to difficulties in accessing project data and standardizing templates, Maxion Wheels sought to implement a digital platform for tracking continuous improvement projects.
Enhancing Project Visibility and Workforce Optimization in Pharmaceutical Manufacturing
-
ChallengeChallenge
A pharmaceutical manufacturing team struggled to track and verify savings generated by its continuous improvement projects. Because initiatives were managed separately across SharePoint, Excel, and Smartsheet, there was no single source of truth for project progress or financial impact. Many projects were abandoned without documentation or accountability, and leaders lacked visibility into who was working on what or how workloads were distributed. This made it difficult to assess performance, allocate resources effectively, or demonstrate measurable business value.
$2 Mtotal verified savings40x ROIwith 20 licenses$915 Kin avoidance savings -
SolutionSolution
The organization implemented Minitab Engage to centralize project management, savings tracking, and workforce visibility. Using Engage’s standardized forms, dashboards, and project repository, all initiatives were logged in one place thus eliminating the need for disconnected spreadsheets and improving accountability.
The built-in ROI tracking dashboards provided real-time visibility into savings by category, while the resource management features allowed managers to see who was working on what and identify overloaded team members. Staffing and prioritization decisions could now be made based on skill sets and current workloads, improving utilization across departments.
Within the first phase of deployment, 20 users were onboarded, enabling the company to track project progress and verified financial impact with complete transparency.
$2 Mtotal verified savings40x ROIwith 20 licenses$915 Kin avoidance savings -
ResultsResults
In the initial rollout, the pharmaceutical manufacturer reported $2.0 million in verified savings across 30 completed or active projects. Savings were distributed as follows:
$915K in cost avoidance $830K in hard savings $165K in soft savings $90K in efficiency savings Of the 30 projects, 12 were completed and 18 were active, with an average project duration of 88 days. By consolidating all project information into Minitab Engage, leadership gained the centralized visibility needed to make data-driven decisions, reduce redundancy, and increase accountability. The unified platform replaced fragmented tracking systems and made verified savings easy to quantify and communicate across the organization. Overall, the deployment delivered an ROI of approximately 40× (4,000%) in its first phase, demonstrating the measurable value of standardizing improvement project management through Minitab Engage.
$2 Mtotal verified savings40x ROIwith 20 licenses$915 Kin avoidance savings
Challenge
A pharmaceutical manufacturing team struggled to track and verify savings generated by its continuous improvement projects. Because initiatives were managed separately across SharePoint, Excel, and Smartsheet, there was no single source of truth for project progress or financial impact. Many projects were abandoned without documentation or accountability, and leaders lacked visibility into who was working on what or how workloads were distributed. This made it difficult to assess performance, allocate resources effectively, or demonstrate measurable business value.
total verified savings
with 20 licenses
in avoidance savings
Solution
The organization implemented Minitab Engage to centralize project management, savings tracking, and workforce visibility. Using Engage’s standardized forms, dashboards, and project repository, all initiatives were logged in one place thus eliminating the need for disconnected spreadsheets and improving accountability.
The built-in ROI tracking dashboards provided real-time visibility into savings by category, while the resource management features allowed managers to see who was working on what and identify overloaded team members. Staffing and prioritization decisions could now be made based on skill sets and current workloads, improving utilization across departments.
Within the first phase of deployment, 20 users were onboarded, enabling the company to track project progress and verified financial impact with complete transparency.
total verified savings
with 20 licenses
in avoidance savings
Results
In the initial rollout, the pharmaceutical manufacturer reported $2.0 million in verified savings across 30 completed or active projects. Savings were distributed as follows:
| $915K in cost avoidance | $830K in hard savings | $165K in soft savings | $90K in efficiency savings |
Of the 30 projects, 12 were completed and 18 were active, with an average project duration of 88 days. By consolidating all project information into Minitab Engage, leadership gained the centralized visibility needed to make data-driven decisions, reduce redundancy, and increase accountability. The unified platform replaced fragmented tracking systems and made verified savings easy to quantify and communicate across the organization. Overall, the deployment delivered an ROI of approximately 40× (4,000%) in its first phase, demonstrating the measurable value of standardizing improvement project management through Minitab Engage.
total verified savings
with 20 licenses
in avoidance savings
- 95% of manufacturers have clear KPIs for quality
- But only 27% are using real-time monitoring
- Nearly 1 in 4 teams still rely on paper or spreadsheets
- 30% use predictive analytics today
- But 52% want to
- Data is coming from everywhere, yet only 26% say it’s immediately usable
This disconnect between aspiration and reality is the core tension shaping the future of quality.
See How Easy It Is To Prove Your CI Impact.
Your team is charged with the responsibility to make improvements to car door functionality for the next model year of the Avanti. Multiple product reviews of the vehicle listed issues with the doors, which led to a recall to repair several units; at significant cost. A thorough, systemized approach will be needed to sort things out and mitigate the risks realized in the current model year.
Key tools used:
- QFD Project (Quality Function Deployment)
- House of Quality
- Value Stream Maps
- Monte Carlo Simulations
-
Show the story behind your success without another meeting.
Ready To Showcase What Your CI Program Is Really Delivering?
Request a specialized demo from our experts.
Form
Visibility Turns Improvement Into Verified Impact
The Tools Powering (and Hindering) Quality Progress
Quality work is evolving—but tools haven’t caught up.
We asked respondents what they use today to manage quality initiatives, SPC programs, and problem-solving projects.
The results showed significant fragmentation:
0%
47% use digital project management platforms (e.g., Asana, Jira)
0%
25% rely on Excel, Word, or SharePoint
0%
24% use internal, custom-built tools
0%
2% still use paper-based methods
Even among the digital adopters, tools often aren’t integrated, automated, or scalable.
Too many teams are doing digital work with analog tools. That’s creating data blind spots, delayed responses, and process inefficiencies that stall real progress.
Where Manufacturers Stand in Their Data Journey
The data is there. But it’s messy, fragmented, and hard to use.
Manufacturers are collecting more data than ever before—but collecting it isn’t the same as leveraging it.
When we asked how teams collect data for quality monitoring, we heard:
Yet despite all this input, only 26% say their data is immediately usable.
Key roadblocks:
- Data lives in different systems
- Manual cleaning or combination is required
- Teams don’t trust the completeness or accuracy of what they’re seeing
The future of manufacturing will be built on connected, clean, and centralized data systems. Many aren’t there yet—but they want to be.
0%
54% rely on operator entry
0%
36% use wireless sensors
0%
48% connect to controllers
0%
32% pull from cloud-connected machinery
What’s Fueling the Push Toward Real-Time Quality
Speed, pressure, and the rising cost of being too late.
Quality teams aren’t just looking for improvement—they’re looking for speed. In an increasingly competitive global market, delayed decisions cost money.
What’s motivating manufacturers to improve their processes?
0%
36% want to keep defect rates stable
0%
23% must meet quality demands as part of a larger supply chain
0%
17% are actively working to reduce defects
0%
14% are focused on minimizing downtime
These goals are difficult—if not impossible—to achieve without real-time feedback loops.
The shift toward real-time SPC isn’t just about monitoring—it’s about gaining the agility to act before problems grow.
Why the Future of Quality is Predictive
Manufacturers don’t just want to react. They want to anticipate.
We asked teams if they’re using predictive analytics or machine learning in their quality efforts.
- 30% use predictive analytics today
- 52% want to use them—but lack training
- 12% aren’t using them at all
- 6% want to—but don’t know where to begin
This tells us something important: the appetite is there. What’s missing is guidance, systems, and support.
Real-world use cases:
- Forecasting process instability
- Identifying root causes before issues spread
- Optimizing production based on historical trends
Predictive analytics can help move manufacturers from “monitoring quality” to actively shaping it.
Unlocking Quality at Scale
You can’t scale quality without solving visibility.
The most advanced quality teams aren’t just making improvements in one plant or one line. They’re building repeatable, scalable systems that work across facilities and teams.
What separates them?
Defects Decrease
Response Times Drop
Operator Trust Increases
Leaders Get Clearer ROI Visibility
If the tools work for one line—they should work for every line.
Unlocking Quality at Scale
You can’t scale quality without solving visibility.
The most advanced quality teams aren’t just making improvements in one plant or one line. They’re building repeatable, scalable systems that work across facilities and teams.
What separates them?
- Connected dashboards that aggregate data across machines and shifts
- Alerts that trigger action, not just logging
- Automations that eliminate manual data entry and reduce variability
We’ve seen that once quality systems become centralized, everything changes:
- Defects decrease
- Response times drop
- Operator trust increases
- Leaders get clearer ROI visibility
If the tools work for one line—they should work for every line.
Embracing the Revolution: What Comes Next
The Quality Revolution isn’t a moment. It’s a movement.
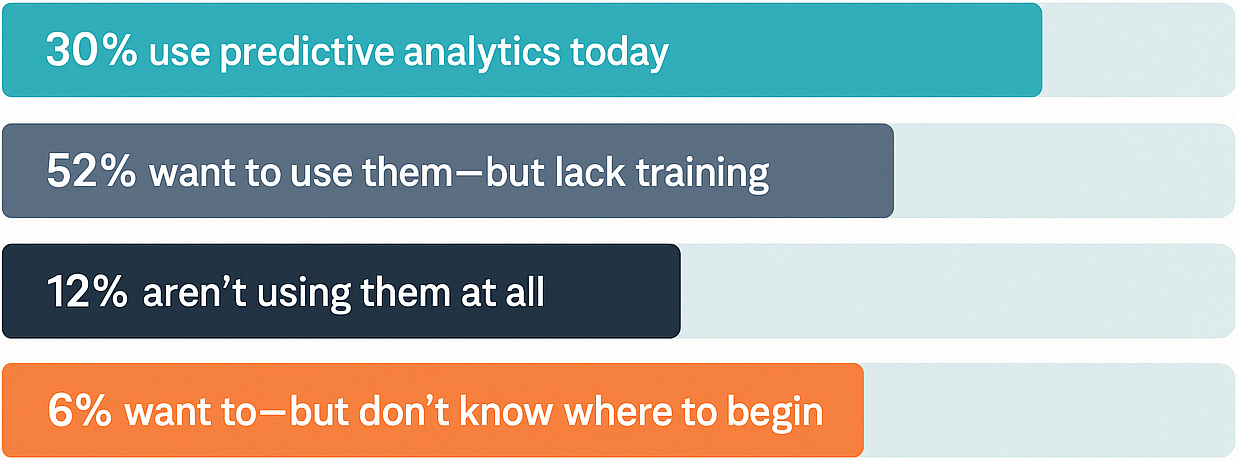
The data is clear: teams are ready for better systems, faster insights, and deeper impact.
But readiness isn’t enough. What’s needed now is action—and alignment.
Here’s what quality leaders should prioritize:
- Break down data silos
- Automate data collection wherever possible
- Invest in centralized platforms
- Shift from reactive monitoring to proactive decision-making
The Solution: Real-Time SPC in Action
Introducing Minitab Real-Time SPC
Minitab Real-Time SPC gives you:
- Live dashboards that monitor every line
- Automated alerts when control limits are breached
- A centralized hub for plant-wide visibility
- Seamless integration with your existing equipment and databases
Perfect for:
- Reducing waste
- Meeting supplier quality agreements
- Minimizing downtime
- Scaling improvement across sites
It’s not just SPC. It’s visibility, accountability, and improvement—built into every shift.