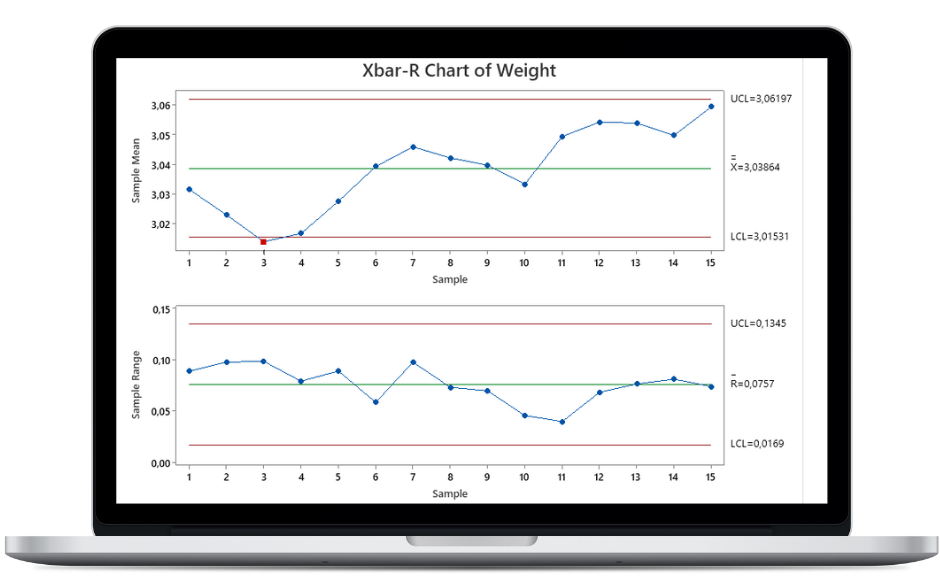
Monitor Process Variation with Trusted Statistical Process Control Charts

Easily monitor whether your process is in control and quickly prevent drifts with Minitab Statistical Software.
Try Minitab Statistical Software's best-in-class control charts for free
No credit card required
Control Charts in Minitab vs. Excel
Unlike crunching numbers with oftentimes error-prone, messy spreadsheets in Excel, Minitab Statistical Software is purpose-built for statistical analysis, offering best-in-class control charts — no coding necessary. Watch below to see how fast and easy it is to create control charts you can trust in Minitab Statistical Software.

.png)
Assess, Verify, and Demonstrate the Performance of a Process
Visualize your process performance with control charts adjusted to your industry needs, including and not limited to:
- Variables Charts for subgroups (Xbar-R, Xbar-S) or for Individuals (I-MR, Z-MR)
- Attributes Charts (P, U, Laney, NP)
- Time-Weighted Charts (EWMA, moving ranges)
- Multivariate Charts
- Rare Events Charts (G, T)
See why 90% of Fortune 100 companies choose Minitab Statistical Software to make better business decisions:

Anshuman S.
Research and Development Engineer
“Minitab Statistical Software helps in creating graphical charts analytical charts and control charts for a large data within a click of the mouse."

Mickey J.
CEO, Management Consulting
“One of the most powerful data analysis tools."

Verified User in Airlines/Aviation
“Built for success for statisticians and non-statisticians alike.”

Brian P.
Continuous Improvement Technician
“Statistical review that Excel can’t do...”

Capterra review
Chemical Laboratory Technician
"Excel is what I used to display the statistical graphics, but after learning how to use Minitab Statistical Software while working in the field, I find it to be more practical since control limits, standard deviation, and control charts don't need to be manually computed."


What Makes Minitab Statistical Software the Easiest Software for Control Charts?
.png)
No Coding Necessary
Analyze results while avoiding missed errors that cause inaccurate answers and messy spreadsheets in Excel.
.png)
Understand Process Behavior
Our control chart visuals are easy to grasp so that you can confirm process shifts and establish limits to ensure results are sustained over time.
.png)
Unrivaled Support
Ditch confusing spreadsheet software and utilize our expert online support, available 24/7.