Unlock the Power of Your Data with Minitab Solution Center

Easily transform your data into actionable insights for better, faster, and more accurate business decisions.
Start Your 14-Day Free Trial
No credit card required

Easy-to-use statistical software to understand your data
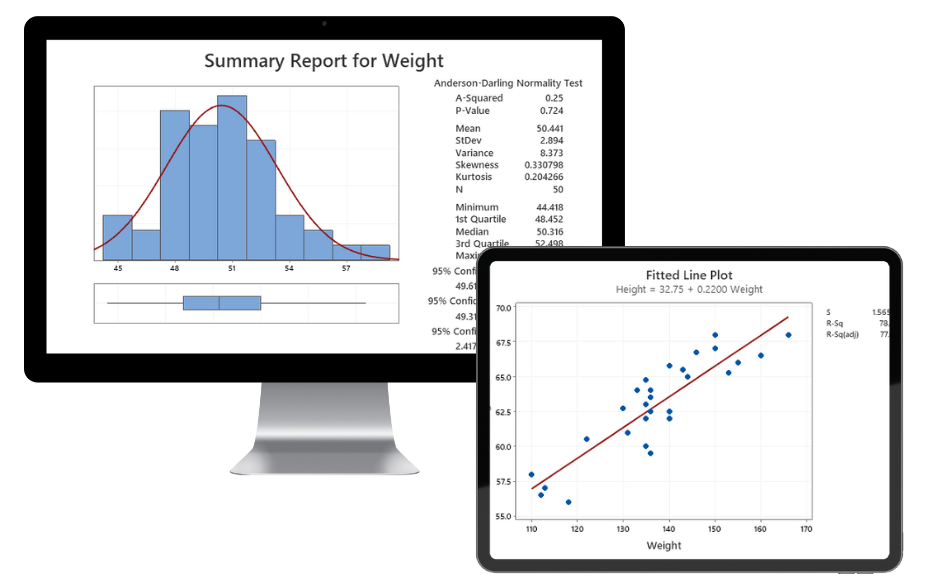
Analyze your data with our top-rated statistical modeling tools and intuitive visualizations. Uncover trends and predictions, reveal outliers, and identify critical variables to drive business decisions with confidence.
Within the Minitab Solution Center, you can leverage tools such as:
- Statistical Modeling: including Regression Analysis, ANOVA, DOE (Design of Experiments), General Linear Models
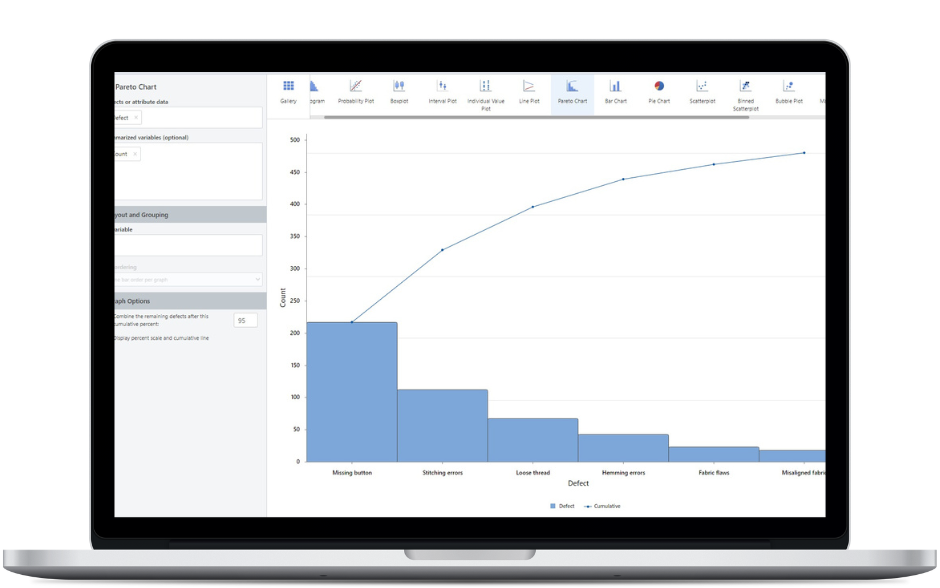
- Graphical Analysis: including Histograms, Bar Charts, Scatterplots, Pareto Charts
- Descriptive Statistics: including Hypothesis Testing, Normality Tests, Correlation, Covariance
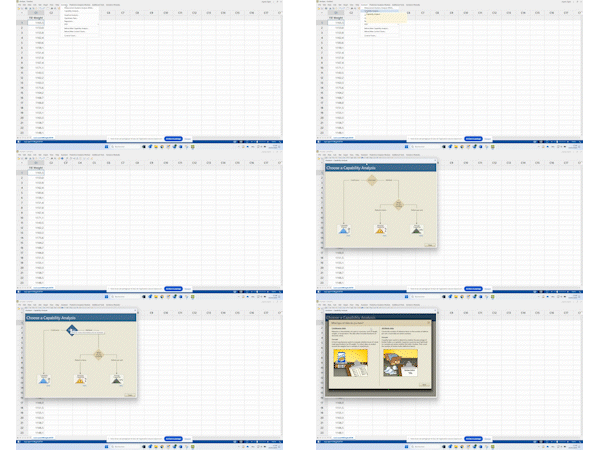
- Quality Statistics: including Measurement System Analysis, Capability Analysis, Control Charts and Sampling
See why 90% of Fortune 100 companies choose Minitab Solution Center to make better business decisions:

Mickey J.
CEO, Management Consulting
"One of the most powerful data analysis tools"

Brian P.
Continuous Improvement Technician
"Statistical review that Excel can't do"

Verified User
Airlines/Aviation
"Built for success for statisticians and non-statisticians alike"


What Makes Minitab the Easiest Statistical Software to Use?

Instant Graph Builder
Swiftly preview, display, and switch between graphs in seconds – no rerunning required.

No Coding Necessary
Analyze results while avoiding missed errors that cause inaccurate answers and messy spreadsheets in Excel.

Unrivaled Support
Ditch confusing spreadsheet software and utilize our expert online support, available 24/7.