USE CASE
Test multiple process settings and select the strongest combination.

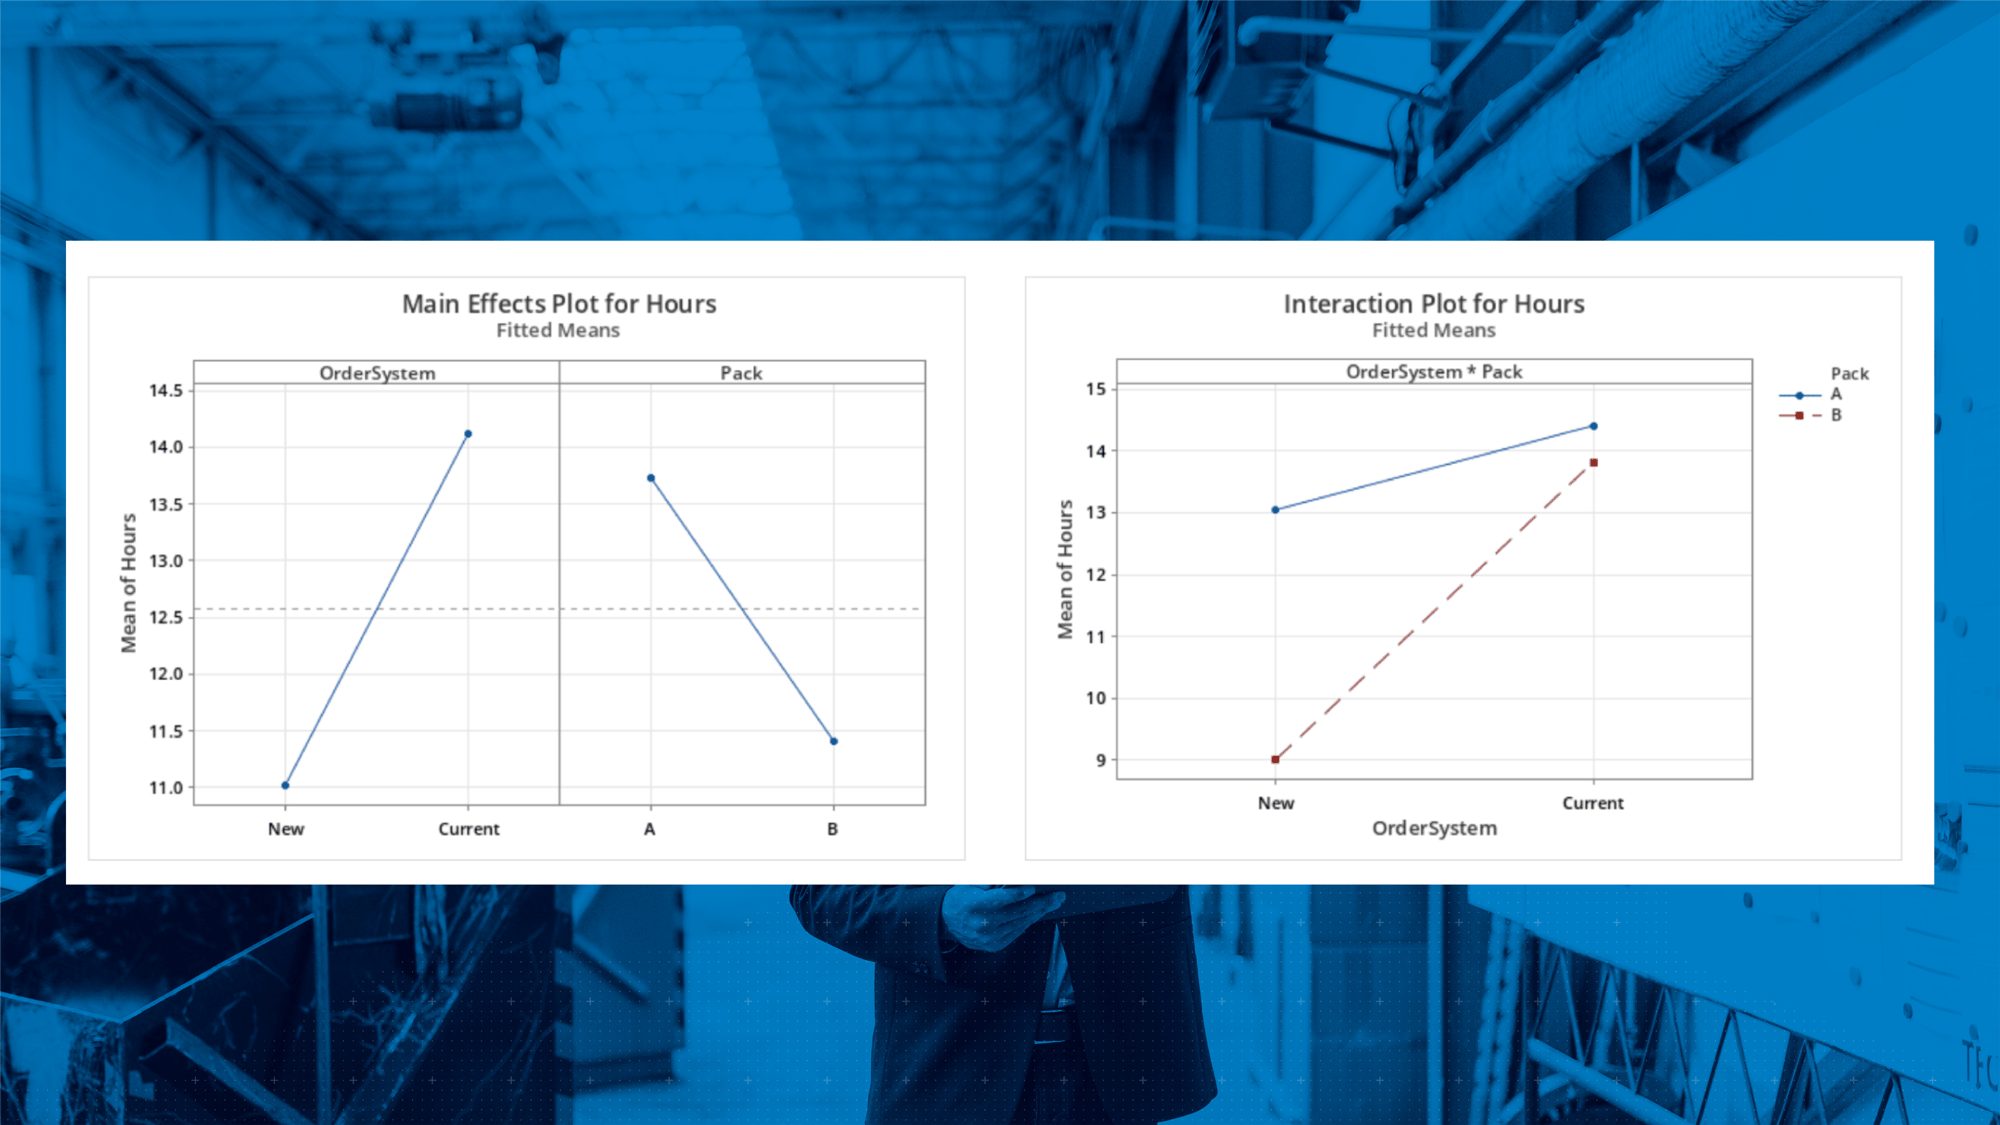
In seven guided steps, you’ll identify which tested combination of order-processing system and packing method produces the shortest preparation time. A factorial DOE tests both factors together, revealing their individual and combined effects. You’ll use the results to recommend the best settings for a confirmation run.
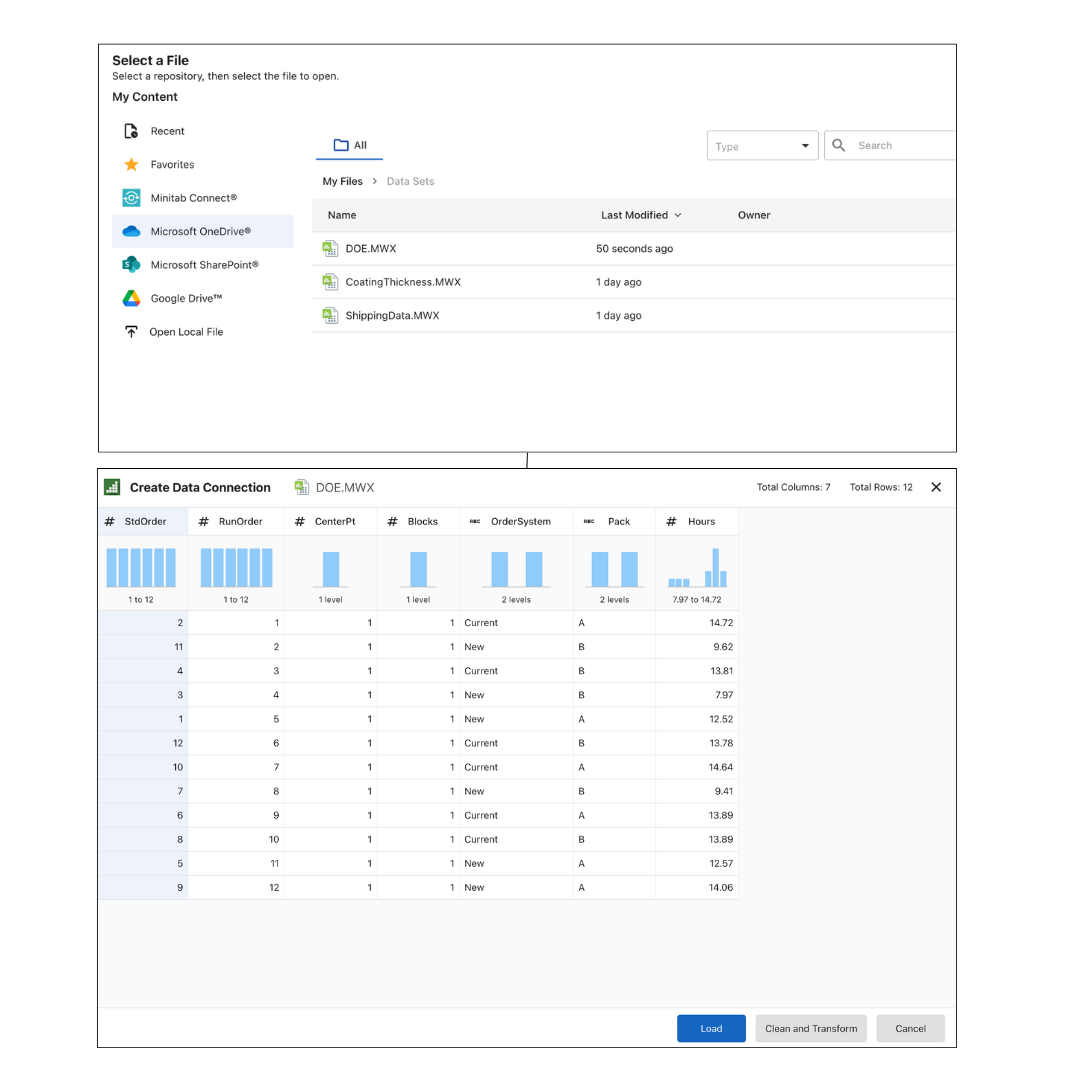
First, download and save DOE.MWX to a folder in your OneDrive, Sharepoint or Google Drive.
From the Minitab Solution Center home page, open Minitab Statistical Software. From the left-hand navigation, select Open, select the DOE file from your saved location and hit the Load button.
This experiment asks: which order-processing setup prepares shipments fastest?
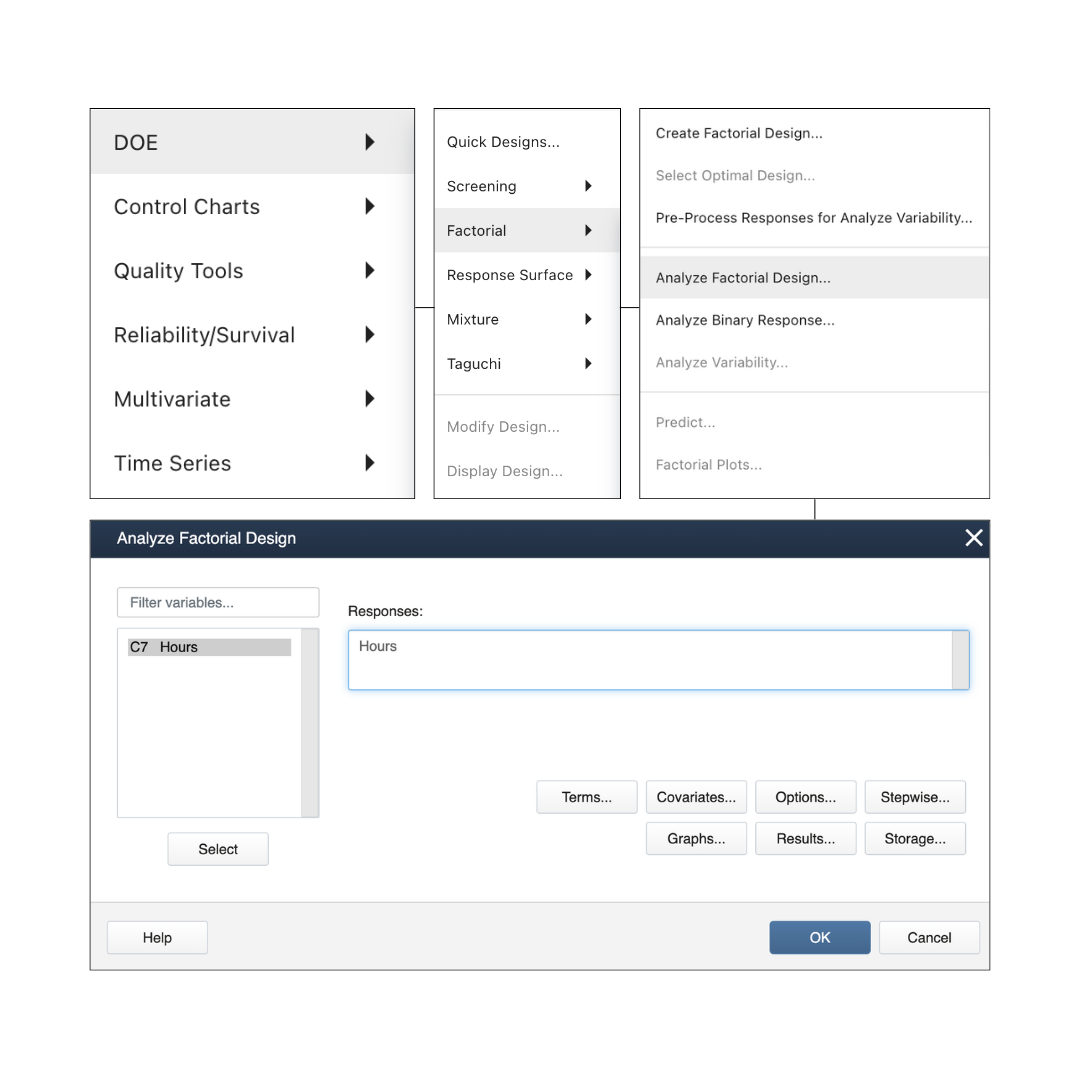
To determine the answer, we need to set up the Minitab project to do a Design of Experiments. Go to: Stat → DOE → Factorial → Analyze Factorial Design.
Click in the Responses input box and select Hours from the list of variables. You can either double-click or hit the Select button to insert Hours into the Responses field.
Don't hit OK just yet. We'll keep this dialog open for the next step.
This tells Minitab that you want to explain what affects preparation time.
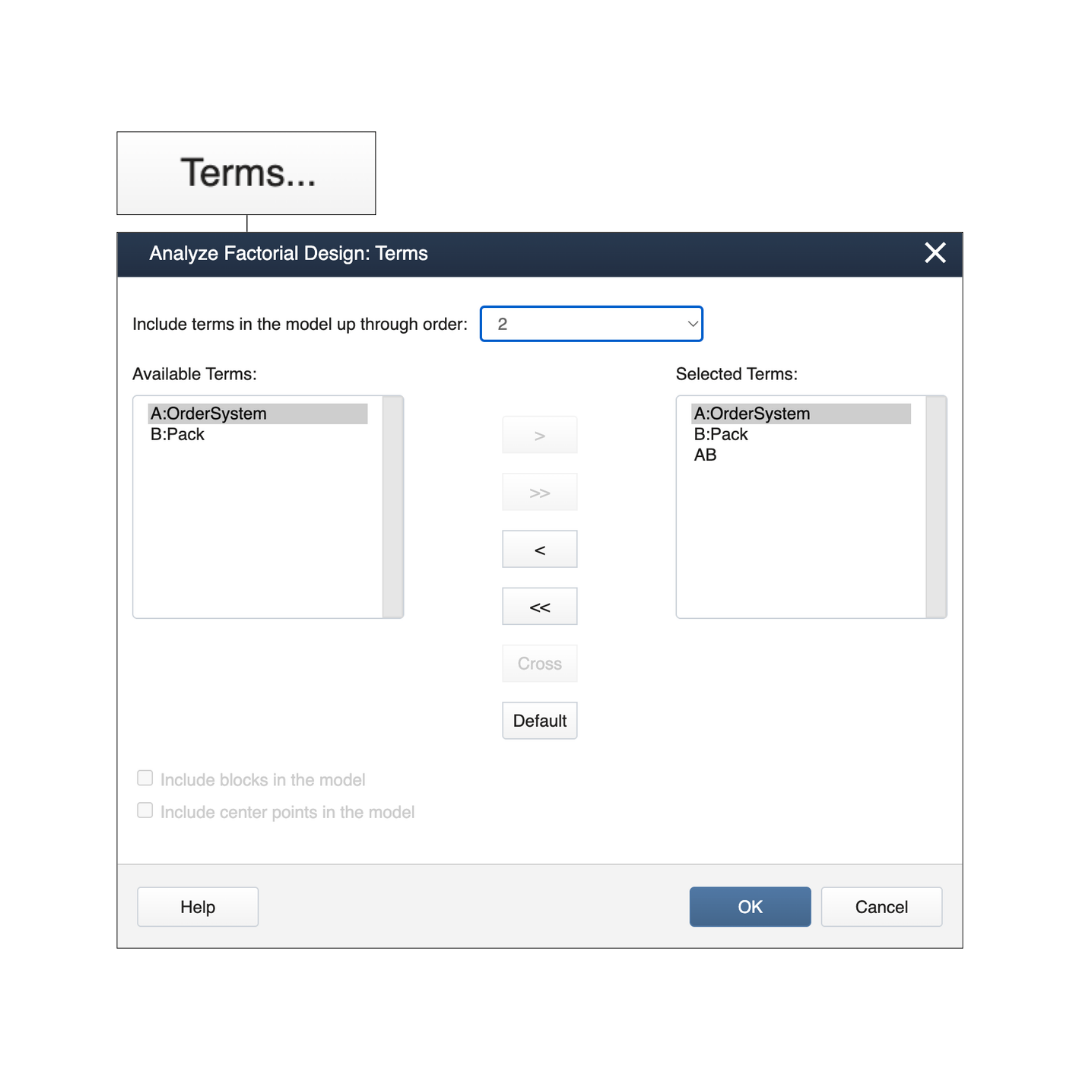
From the same Analyze Factorial Design dialog you’re on, click Terms. Choose the following setup:
Include terms in the model up through order: 2
This tests:
The interaction term shows whether packing method affects hours differently for each order system.
Click OK once to return to the Analyze Factorial Design dialog.
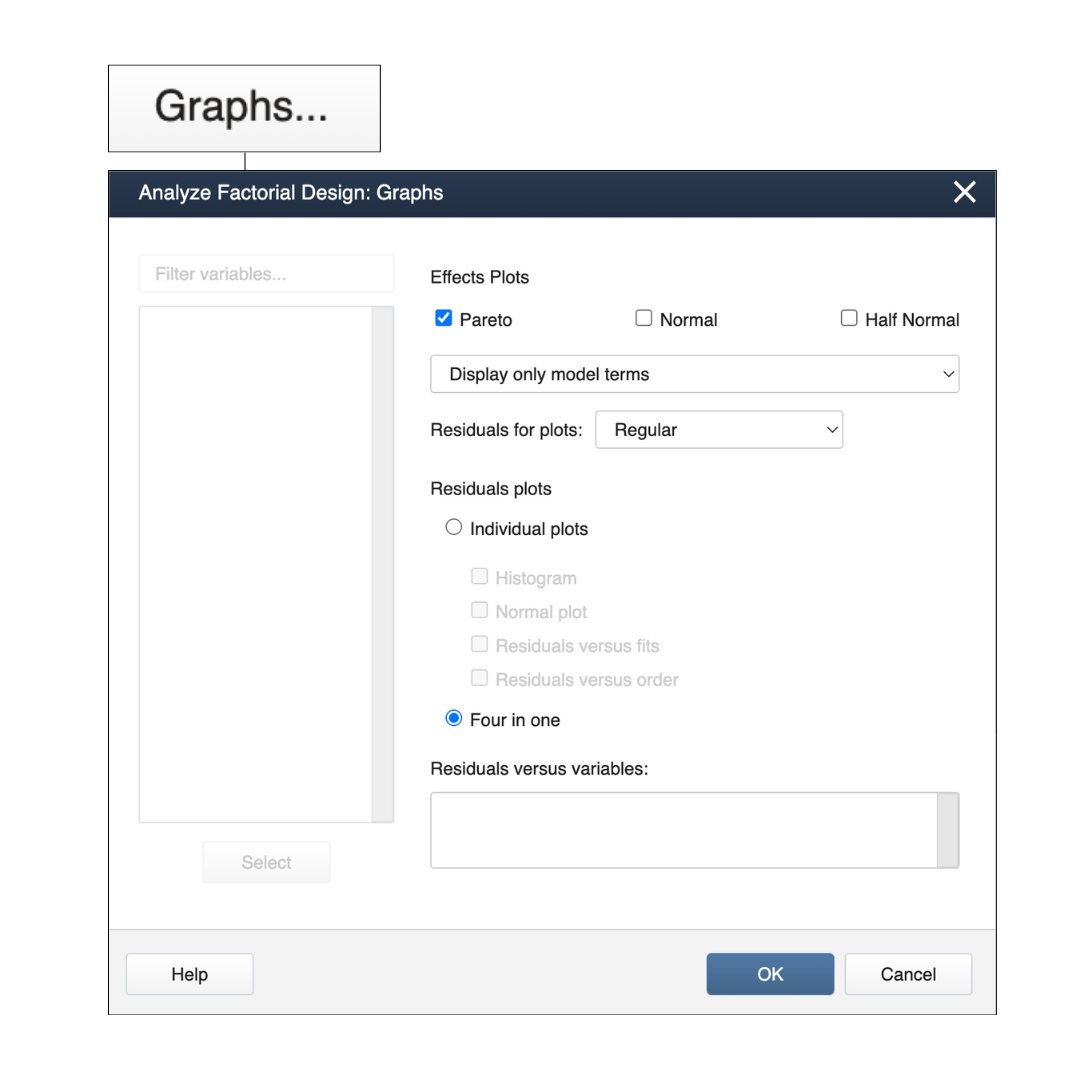
Now, from the Analyze Factorial Design dialog, click on Graphs..., make sure Pareto is selected as well as Four in one under Residuals plots.
The Pareto chart shows which factors have the biggest effect on Hours. Residual plots check whether the model is reasonable.
Once you’ve selected your graphs and hit OK, hit OK again on the main Analyze Factorial Design window to see results.
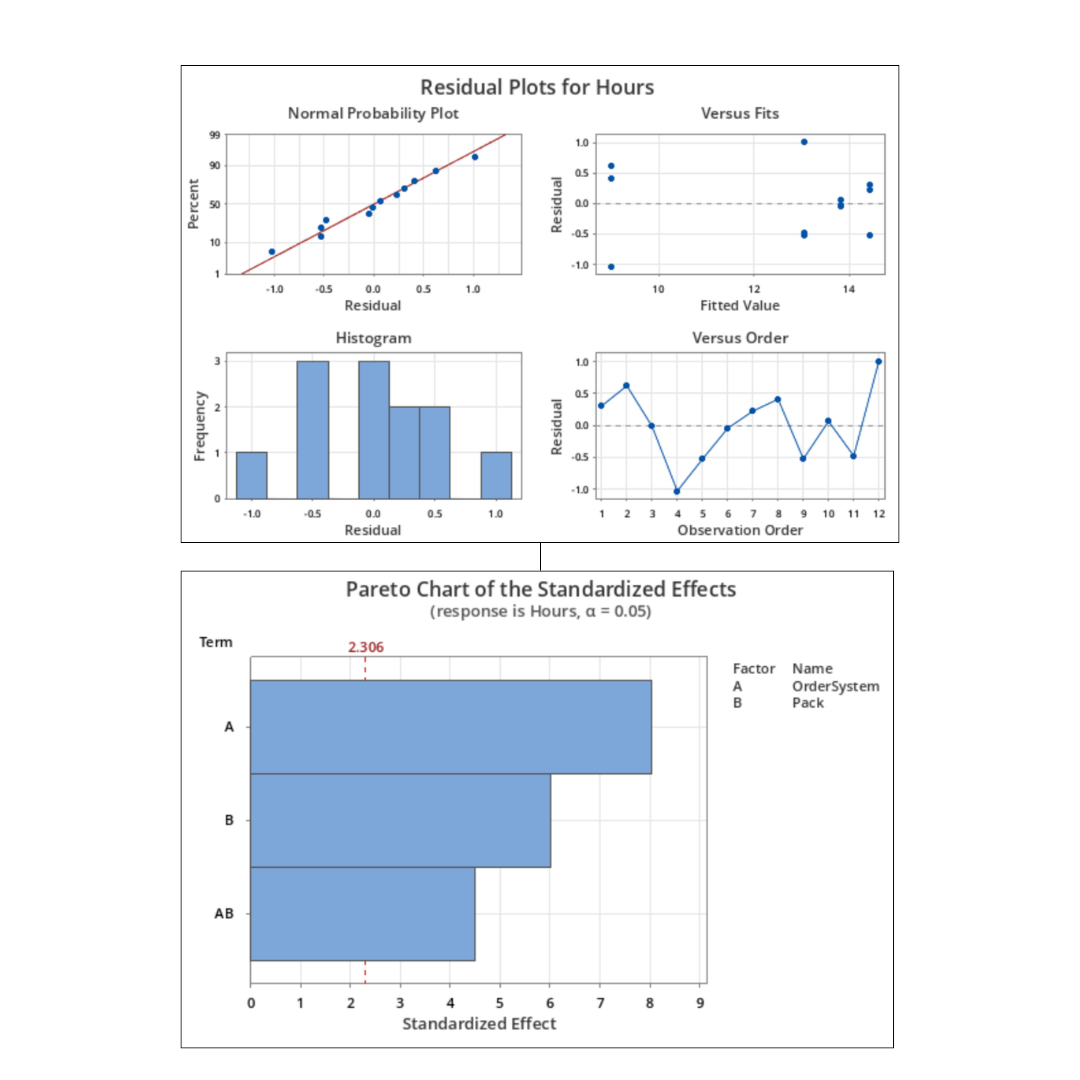
Scroll down through your Factorial Regression to see your newly created charts.
Start with the Pareto chart. It shows which factors have the biggest effect on Hours.
In this example:
Because the interaction is significant, don’t interpret the order system and packing method separately. The best result depends on using the right combination.
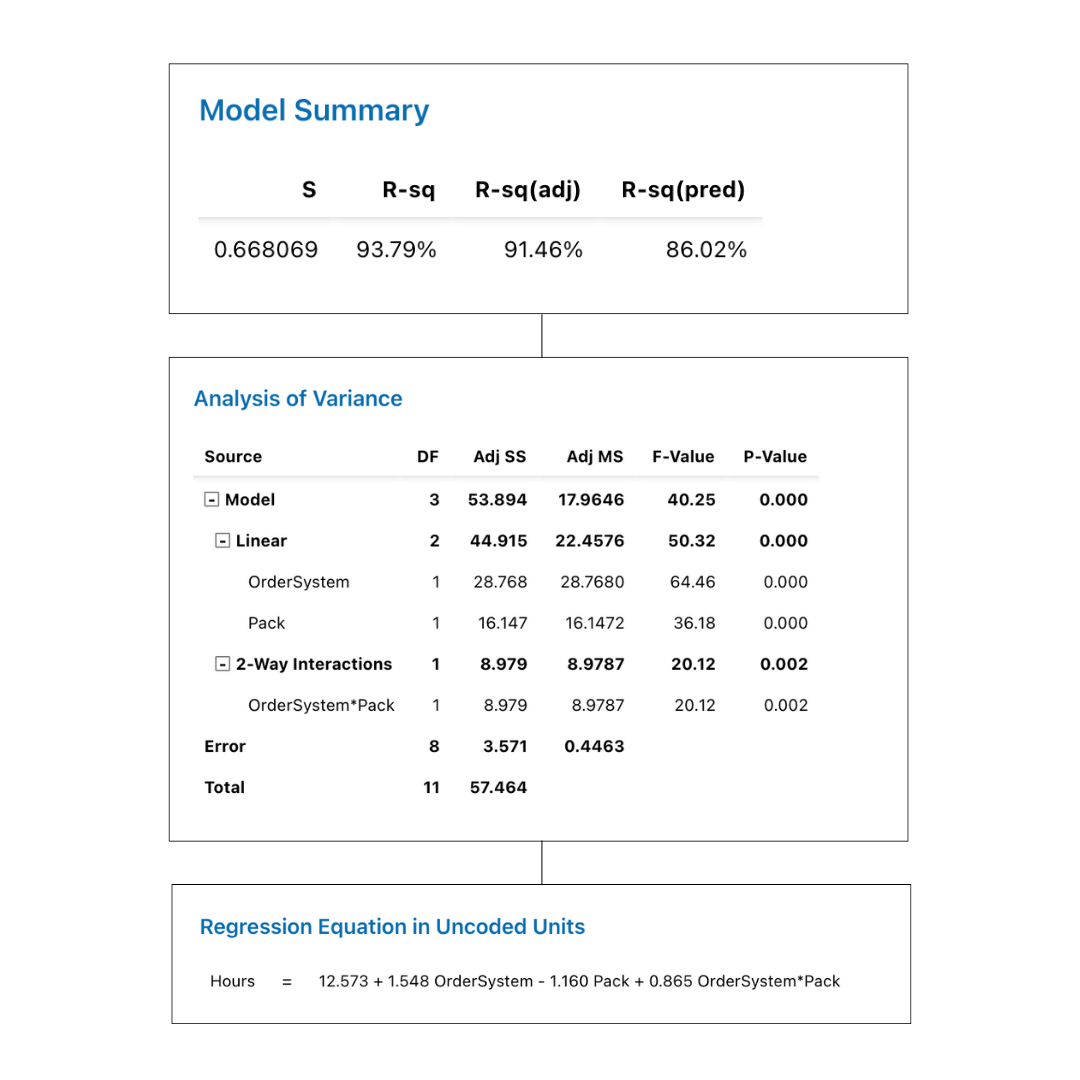
Scroll back up and use the Model Summary, ANOVA (Analysis of Variance) table, and Regression Equation together.
In simple terms, this means that both the order-processing system and packing procedure affect preparation time, and the best packing method depends on which order system is used. Recommend the combination with the lowest predicted hours, then confirm it with a follow-up run.
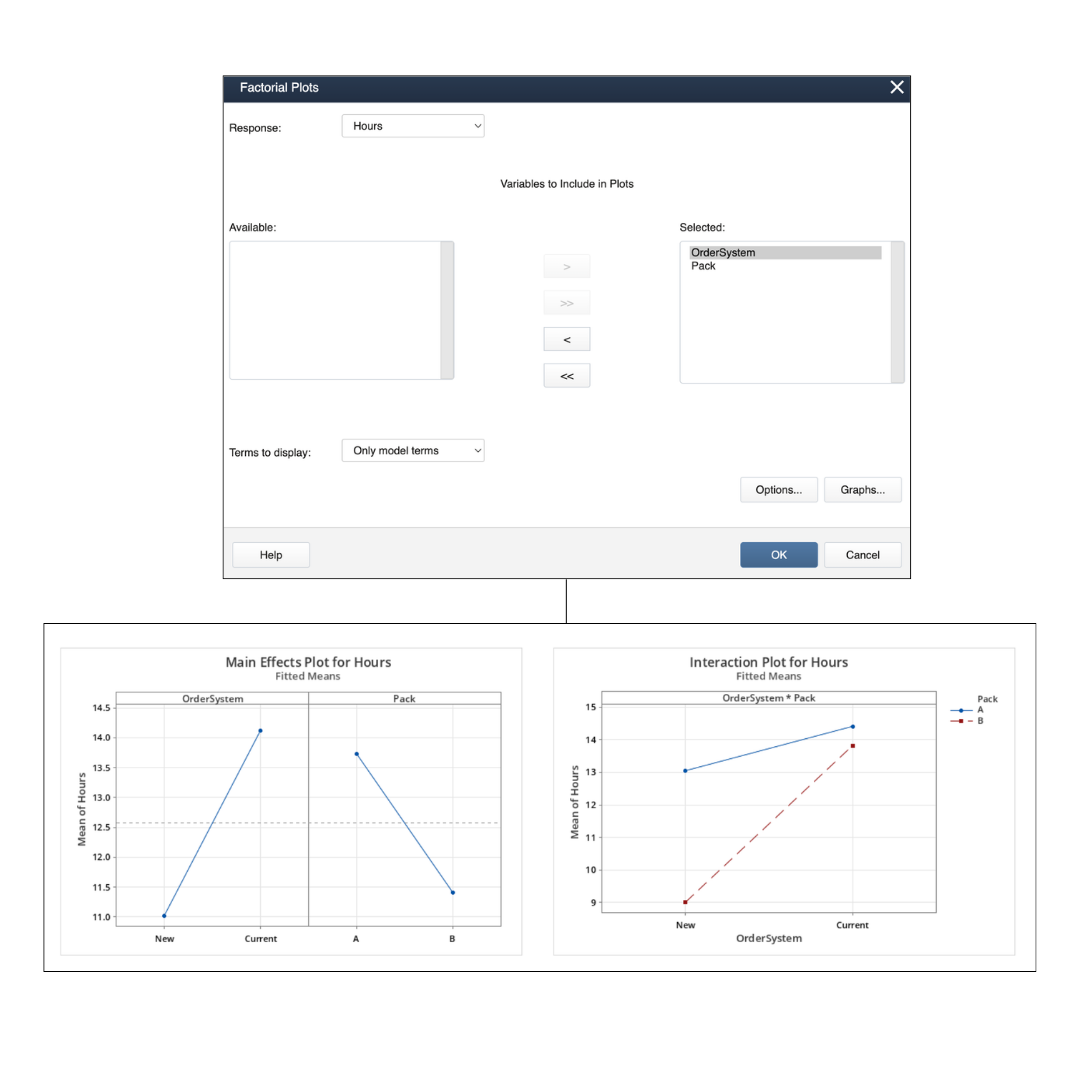
Open Stat → DOE → Factorial → Factorial Plots and create an Interaction Plot for Hours using OrderSystem and Pack. The default settings will already be applied, so click OK and you'll see two new charts on-screen.
On the Interaction Plot for Hours chart, look for the lowest point on the plot: that is the fastest predicted setup.
The interaction plot shows that the fastest setup is the New order system with Pack B. The non-parallel lines also confirm the interaction: Pack B helps much more with the New system than with the Current system.

Clean your data faster so you can focus on analysis.
Learn more
Make your insights visible across your organization.
Learn more
Identify root causes and remove bottlenecks.
Learn more
Learn how to predict what will happen next based on current data.
Learn more