USE CASE
Classify a binary outcome and explain the factors behind the prediction.

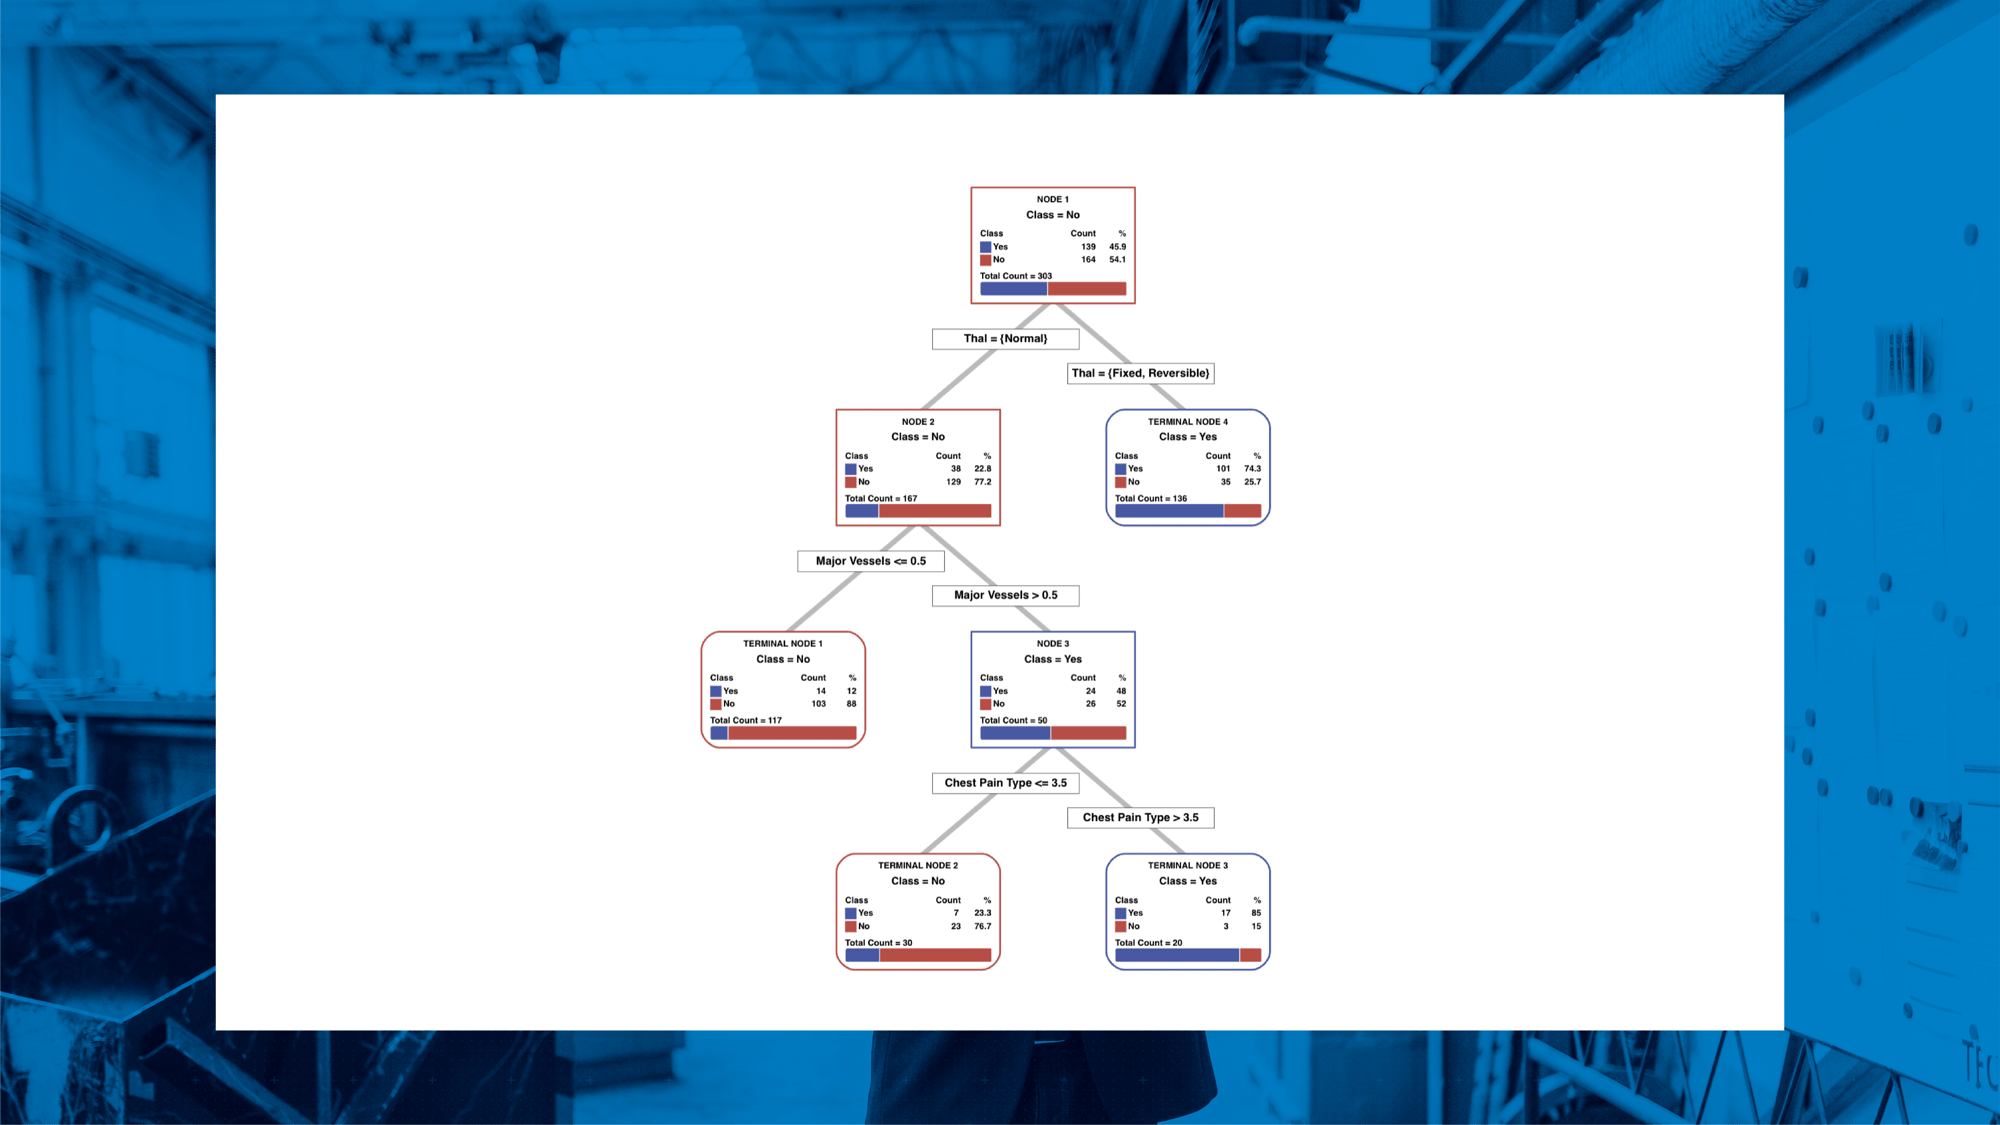
Follow six guided steps in Minitab to build, check, and interpret a CART® Classification tree.
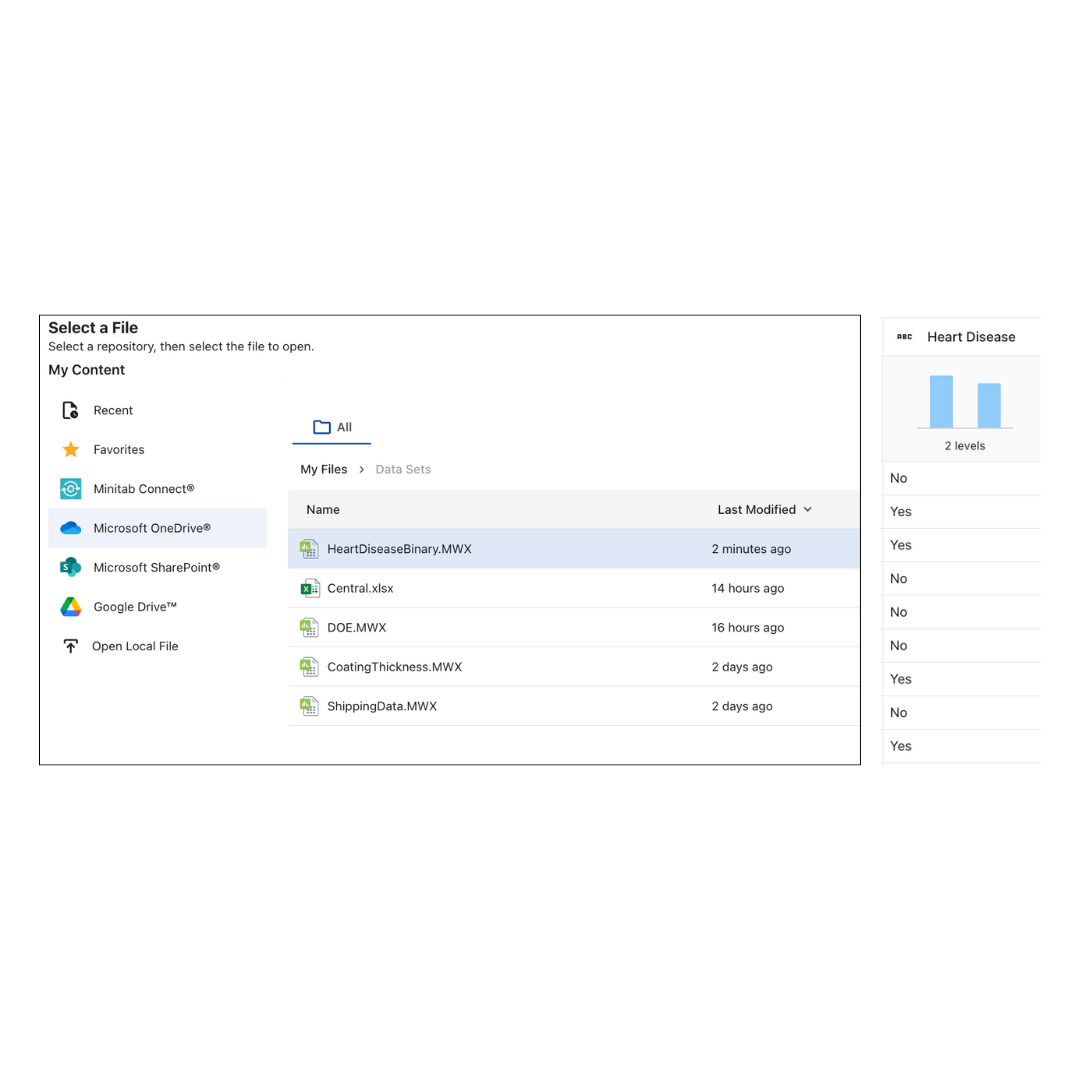
Download HeartDiseaseBinary.MWX and add it to a folder in your OneDrive, Sharepoint or Google Drive, same as before. Inside Minitab Statistical Software, select Open on the left-hand navigation and open the file from your saved location.
In the preview window scroll along to the response column, Heart Disease, which has two outcomes: Yes or No. The question for this lesson is: Which patient factors help classify whether heart disease is present?
Click Load.
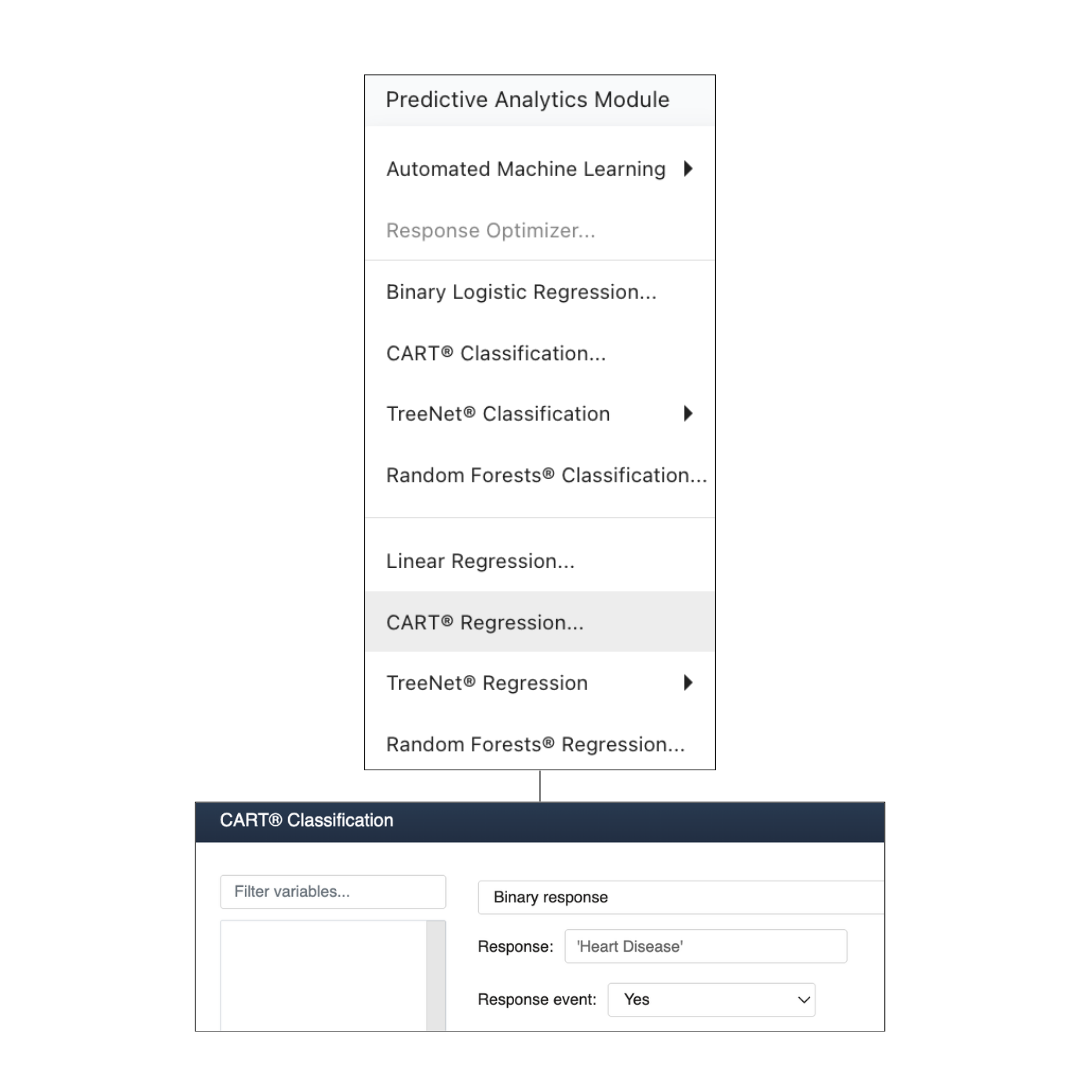
Choose Predictive Analytics Module > CART® Classification. Select Binary response in the dropdown field, because Heart Disease has only two possible values.
Click inside the Response field and select Heart Disease from the list of variables, by either double-clicking or clicking once and hitting Select.
Response event: Yes
Choosing Yes tells Minitab to focus the output on predicting heart disease, not the absence of it.
Don't hit OK just yet. We'll stay on this same dialog for the next step.
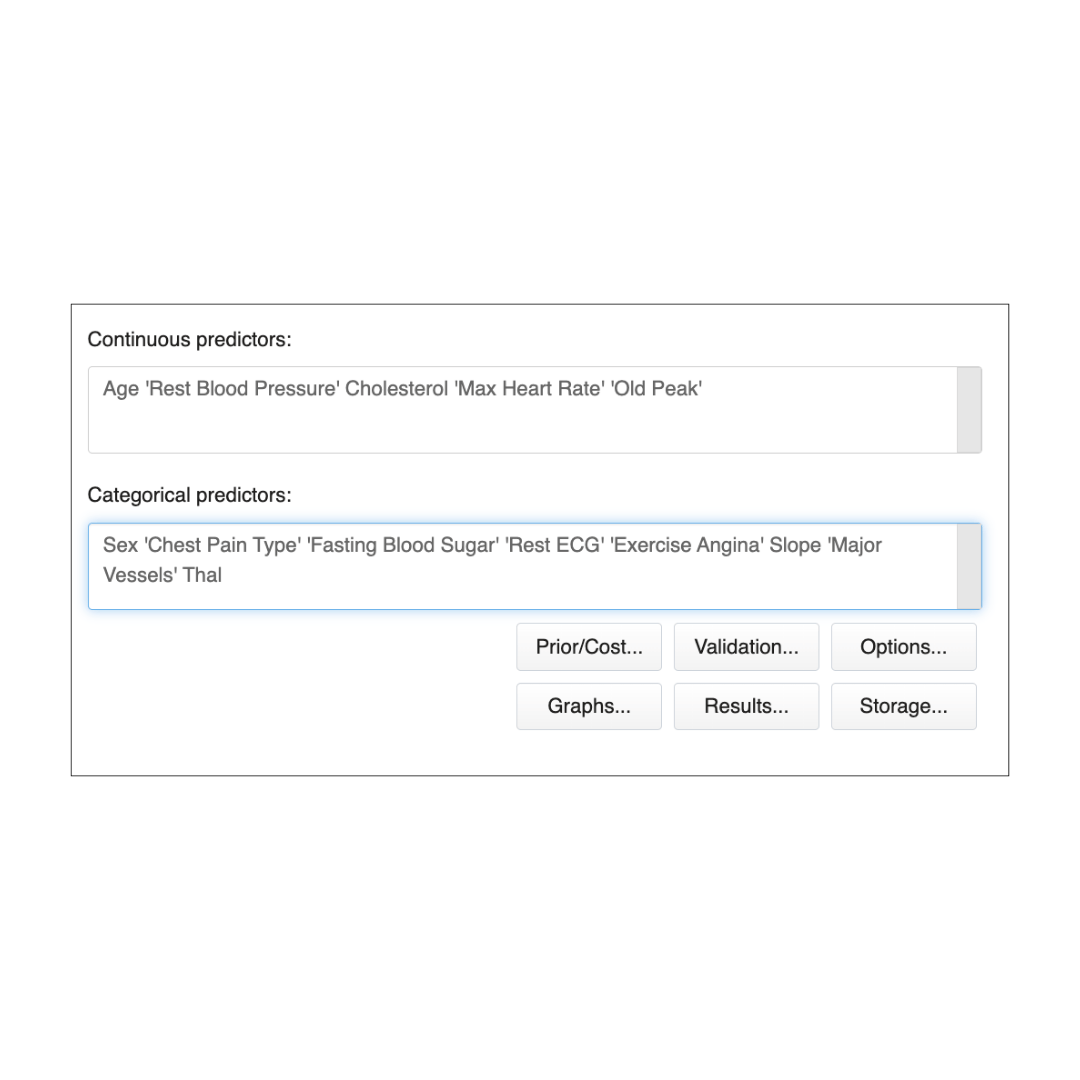
Add the measured numeric fields as Continuous predictors:
Select the predictors below by pressing Ctrl + clicking each one then hitting Select. Or alternatively paste this list directly into the Continuous predictors field:
Age
'Rest Blood Pressure'
Cholesterol
'Max Heart Rate'
'Old Peak'
Add the group or category fields as categorical predictors:
Sex
'Chest Pain Type'
'Fasting Blood Sugar'
'Rest ECG'
'Exercise Angina'
Slope
Major Vessels
Thal
Click OK and you’ll see an Optimal Tree Diagram appear, along with several charts.
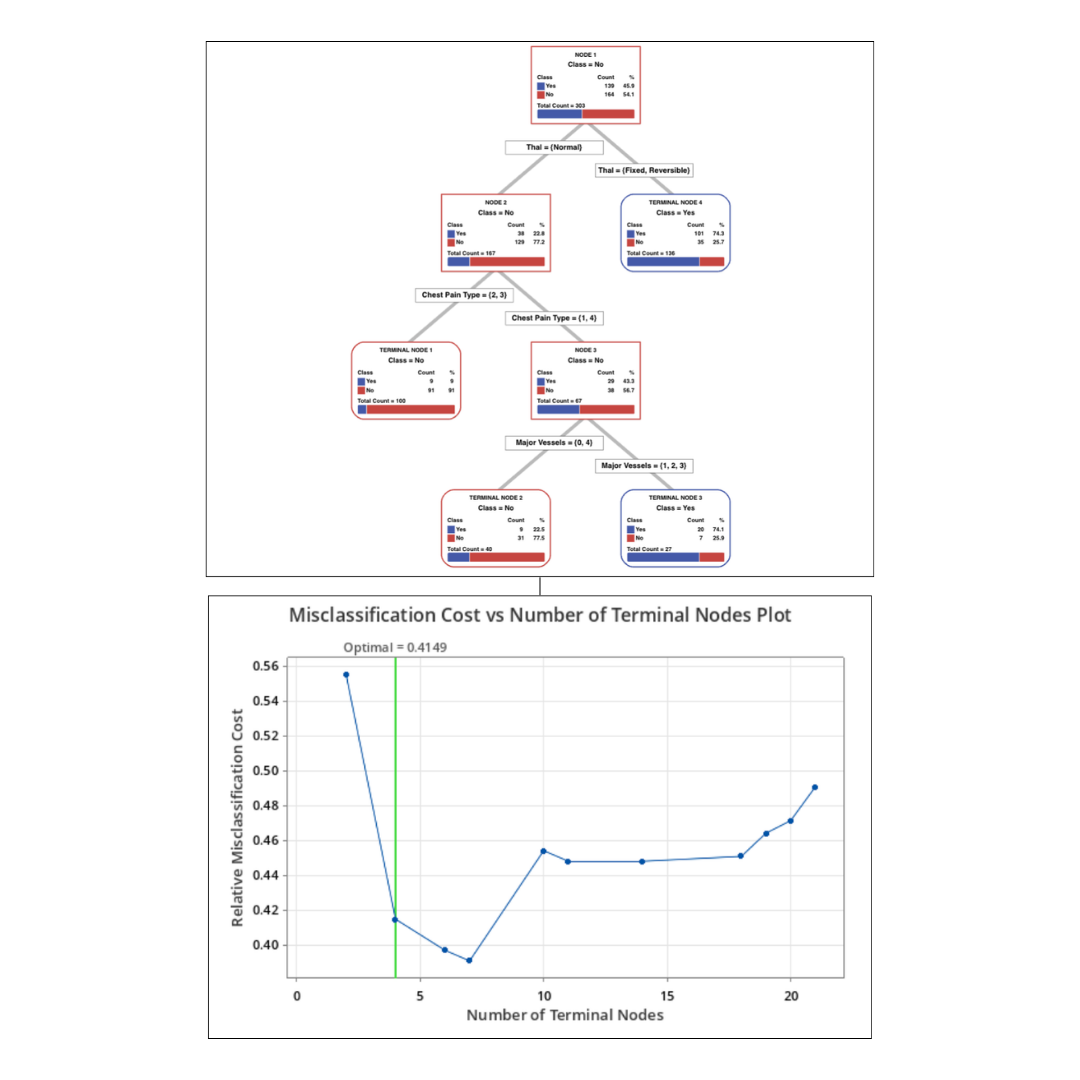
The tree shows how the model makes a prediction. Start at the top and follow the branches down. In this result, Minitab first splits patients by Thal, then uses Chest Pain Type and Major Vessels for the remaining groups. Each final box predicts either Heart Disease = Yes or No.
The Misclassification Cost vs Number of Terminal Nodes Plot explains why Minitab chose this tree size. A larger tree may fit the training data a little better, but it can become harder to explain.
Minitab selected a 4-terminal-node tree because it keeps the model simple while staying close to the lowest classification error. You don’t need to master all this—it’s just what’s happening inside CART®.
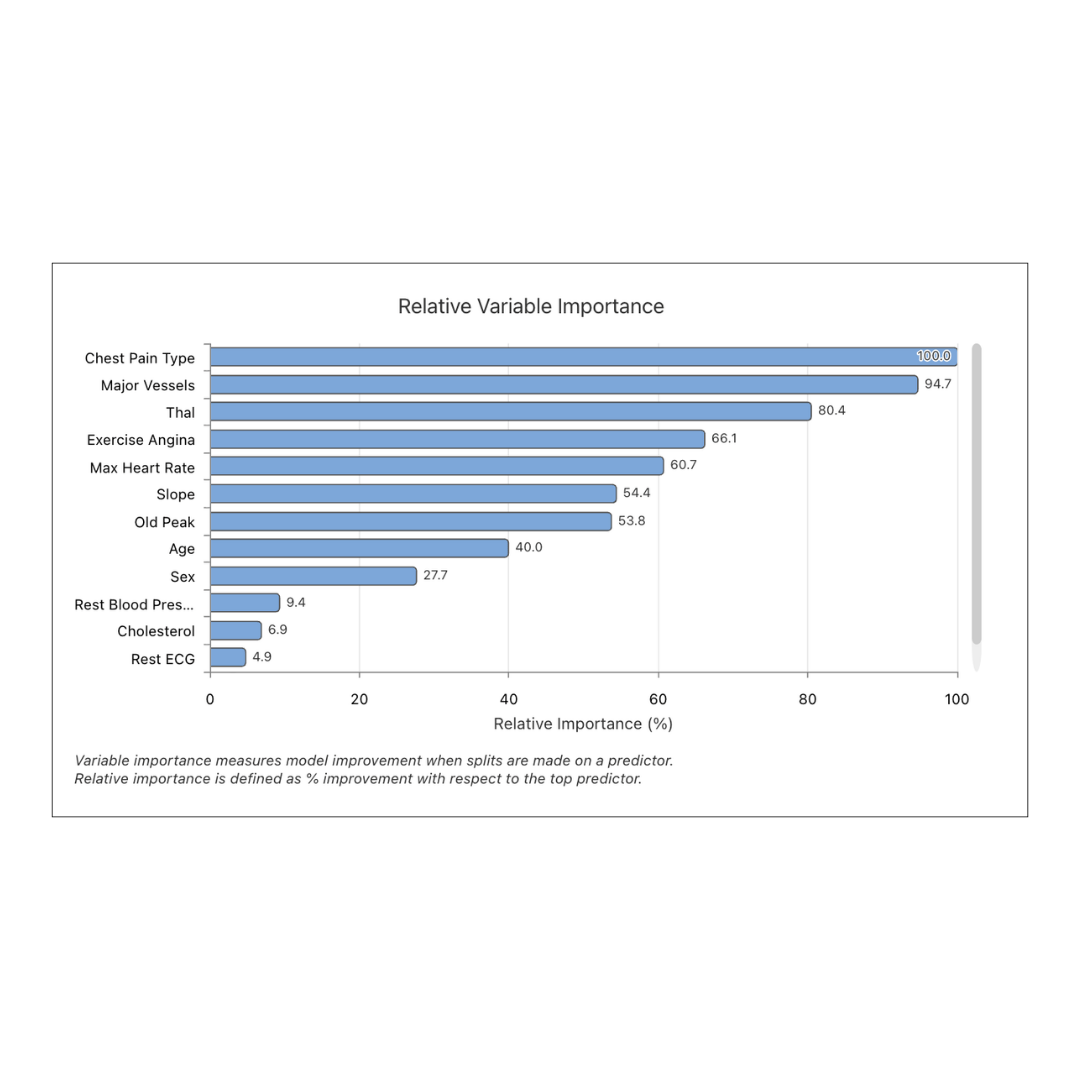
After the tree loads, scroll to the Relative Variable Importance chart. This chart ranks the predictors the model used most to separate Heart Disease = Yes from No.
In this CART® Classification, the strongest predictors are:
Variable importance means “most useful for prediction.” It does not prove that the variable causes heart disease.
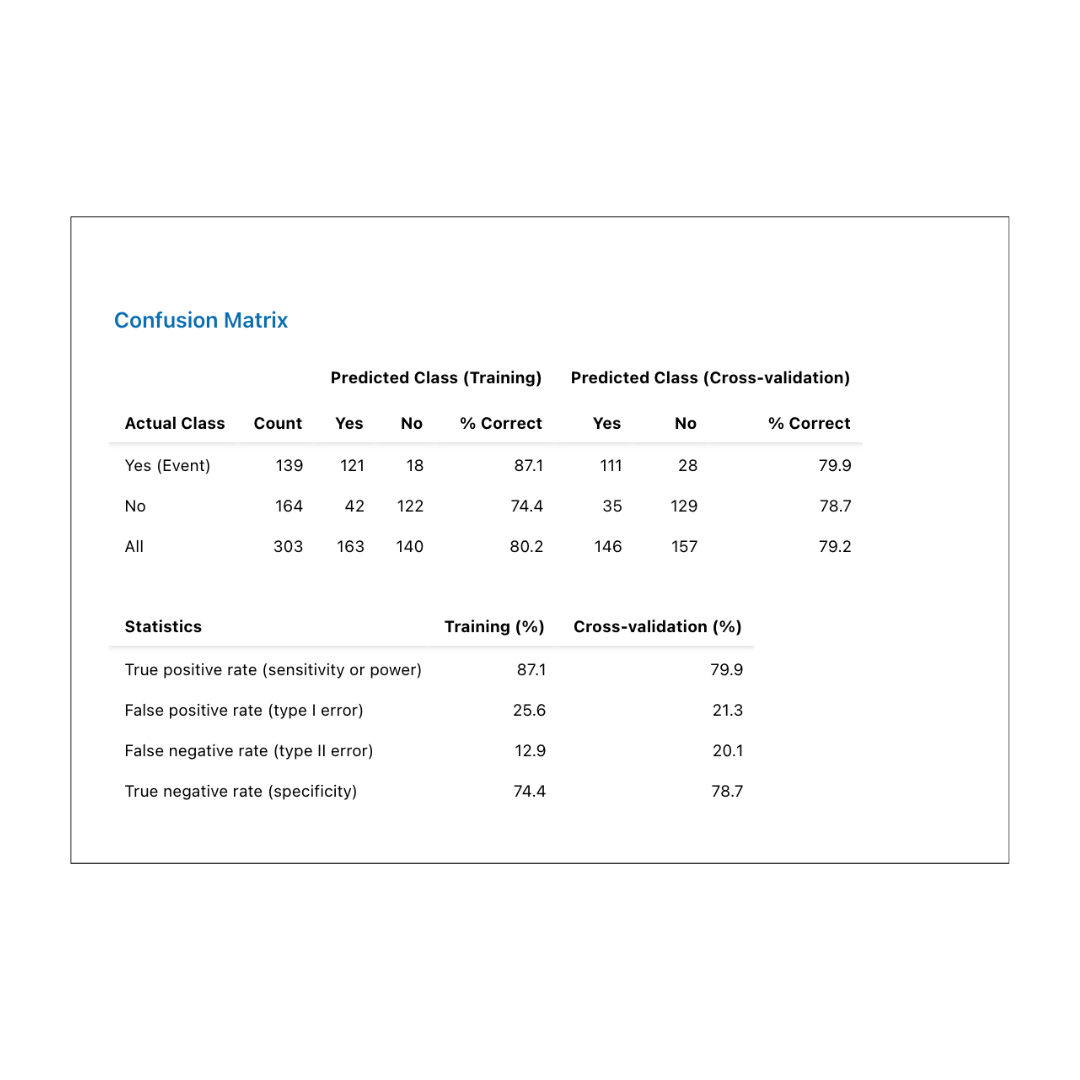
Last, scroll to the the Confusion Matrix. This table compares the actual outcome to the model’s predicted outcome.
In this result, the model correctly classified:
The model is better at identifying patients with heart disease than ruling it out.