
The Choice of Global Leaders for Data-Driven Success.
You face complex challenges every day, from making smarter decisions to accelerating performance with less risk. The world’s top teams know that data is the key to driving measurable, lasting results.
That’s where Minitab comes in. With decades of proven expertise, Minitab delivers the end-to-end analytics and process improvement solutions that global leaders trust. From identifying opportunities and managing data to monitoring quality and simulating outcomes, our integrated platform equips you to achieve results with confidence.
Keep reading to see how teams around the world are transforming their performance with Minitab.

The Measurable Impact of Choosing Minitab
Leading teams don’t just trust us, they see results in time, money, risk, and ROI.
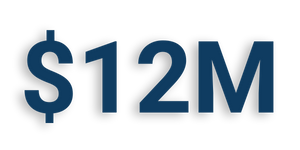
Annual Savings
By combining efficiency gains with smarter resource use, Minitab delivered a measurable financial impact of $12 million per year.

Boost in Production
Organizations using Minitab significantly improved process throughput, accelerating performance and reducing bottlenecks.

Lower Costs
Minitab empowers teams to streamline operations and cut unnecessary expenses, unlocking immediate and long-term savings.

Increase in Revenue
Smarter decision-making with Minitab translates directly into top-line results, adding over $1 million in new revenue streams.
Seasonal Temperature Impact Analysis
Challenge
A chemical manufacturer was experiencing variability in results from batch to batch and sought to find reasons for these inconsistent results. They aimed to validate the theory that seasonal temperature changes in their geographic area could affect production. Specifically, they needed to determine if the initial temperature of the machine was a valid factor, as heating something up when it is already hot out versus when it is cold out might affect the process.
Products
Minitab Real-Time SPC and Minitab Prolink
Solution
Using Minitab SPC solutions (Real-Time SPC or Prolink), they smoothed the raw data with an EWMA chart to quickly identify when seasonal temperature affects production results. This chart helped validate the significance of initial machine temperature as a factor in production consistency and allowed personnel to make timely adjustments.
Results
This discovery allowed them to consider temperature fluctuations in developing their production process and planning for manufacturing and shipping timelines. The analysis confirmed that initial temperature is a factor to be considered, aiding in resolving batch variability issues. Following the data in real time using an EWMA chart allowed them to quickly make adjustments when ambient temperature came into play.
Inconsistent batches can result in scrap, rework, or regulatory non-compliance. Studies show that batch manufacturing losses due to variability can reach $500,000–$1 million annually for mid-sized chemical plants. Real-time Statistical Process Control (SPC) tools allow manufacturers to detect process drift early, reducing waste and improving responsiveness. A manufacturer processing 400,000 parts/year with a 4% scrap rate loses $160,000 annually. Reducing batch variability by 25–50% could save $40,000–$80,000 annually, depending on material costs and the extent of process improvement.
- $500K–$1M annually: batch manufacturing losses due to variability in mid-sized chemical plants
- $160K annually: losses from a 4% scrap rate at 400,000 parts/year
- $40K–$80K annually: savings by reducing batch variability by 25–50% with SPC
Ensuring Precision in Intraocular Lens Injection Systems
Challenge
In cataract surgery, lenses are now often implanted using an intraocular lens injection system rather than forceps. The organization designed a syringe-like injector preloaded with the lens, allowing surgeons to use an automated implant mechanism. The force applied by the syringe must be carefully controlled to avoid damage.
Products
Minitab Statistical Software, Minitab Engage
Solutions
The organization followed a DMAIC process when developing the new injector. Several tools including t-tests were used to evaluate statistical differences in injector pressure between the old and new design.
Additionally, a two proportions test demonstrated that the proportion defective was reduced with the new design.
Results
The organization gained a better understanding of the performance of their new devices, ensuring they meet the necessary parameters. This confidence in their process and data continues to allow them to develop new and improved products.
In addition to these qualitative benefits, research on preloaded intraocular lens (IOL) injector systems shows measurable, tangible outcomes: surgeries save 30 seconds to over 1 minute per case, which compounds into 5–8% more throughput annually, equating to up to 1,440 additional surgeries per year. These efficiencies generate $284,000–$565,000 in additional revenue per facility each year, while also reducing contamination risks by eliminating unnecessary IOL touches and minimizing setup delays.
- 30s–1 min per case saved: time reduction with preloaded intraocular lens (IOL) injector systems
- 5–8% more throughput annually: up to 1,440 additional surgeries per year
- $284K–$565K annually: additional revenue per facility from efficiency gains
- Reduced contamination risk: fewer IOL touches and setup delays, improving patient safety and efficiency
Automated Drug Stability Testing
Challenge
A stability test evaluates how a drug or product maintains its potency, purity, and quality over time under various conditions like temperature, humidity, and light. Scientists in the pharmaceutical industry use these tests to determine product shelf life as well as to guide proper storage, handling, and labeling instructions. Because the same tests are run on many variables across multiple batches and lots at multiple time points, automating this work is key to efficiency.
Products
Minitab Statistical Software, Minitab Connect
Solution
Minitab Connect was configured to automatically read the latest data, manipulate it for analysis, run a stability study using Minitab Statistical Software, and report results back to the Connect Dashboard where the results could be shared with the US FDA.
Results
The time to generate each FDA stability report has dropped from several hours to fully automated, enabling immediate updates whenever new data becomes available. Industry-wide, such automation typically leads to a 40%–90% reduction in manual data entry errors, as well as a 40%+ increase in productivity thus freeing analysts to focus on higher-value tasks rather than repetitive reporting. Stability software also helps ensure strong regulatory compliance, maintains data integrity through audit trails, and delivers consistently formatted, submission-ready reports, minimizing risks of non-compliance or data integrity issues.
- Several hours to automated: time to generate each FDA stability report reduced to real time
- 40%–90% reduction: fewer manual data entry errors through automation
- 40%+ increase: productivity gain, freeing analysts for higher-value work
- Reduced compliance risk: submission-ready reports and audit trails minimize costly errors
Bottling Plant Quality Improvement
Challenge
A bottling plant Quality Engineer struggles with inconsistent product quality due to reactive problem-solving. Issues like fill levels that are too low or too high, misaligned labels, and inconsistent carbonation are often identified after significant scrap and rework have occurred, leading to lost time and money. Outdated reports and manual data compilation hinder timely identification of root causes.
Products
Minitab Statistical Software, Minitab Real-Time SPC and Minitab Prolink
Solution
Minitab Real-Time SPC and Prolink provides instant visibility into production data, enabling the Quality Engineer to detect deviations in fill levels, carbonation, and capping processes in real time. Control charts alert to shifts and trends, allowing for proactive intervention before defects accumulate. Integrated with Minitab Statistical Software, the Quality Engineer can perform advanced analysis directly from the Real-Time SPC dashboard.
Results
By implementing Minitab SPC solutions, the bottling plant achieved dramatic reductions in scrap and rework, enabling early detection and correction of process deviations. This led to improved fill-level consistency, reduced downtime, and fewer customer complaints, all of which translated into measurable cost savings and enhanced customer satisfaction.
Industry research shows that beverage plants typically lose 1–3% of production to scrap and rework, which can cost $500,000–$1.5M annually for a mid-sized bottling facility producing ~200M bottles per year. Real-time SPC solutions have been shown to cut scrap and rework by 50–90%, reducing escaped defects from 8% to just 0.5%. For a plant with annual scrap costs of $1M, this translates into $500,000–$900,000 in savings per year. In addition, reduced downtime and fewer complaints lower warranty claims and protect brand reputation, further improving financial performance.
- $500K–$1.5M annually: typical scrap and rework losses for a mid-sized bottling plant
- 50%–90% reduction: scrap and rework savings possible with Real-Time SPC
- $500K–$900K annually: savings per year for a plant with $1M scrap costs
- 8% to 0.5%: reduction in escaped defects with real-time monitoring
Reducing Time in the Emergency Department (ED)
Challenge
Reducing time in the Emergency Department (ED) is essential to identify bottlenecks, reduce wait times, improve resource allocation, enhance patient experience, and increase efficiency. Effective management of ED processes is crucial for providing timely care and optimizing the use of healthcare resources.
Products
Minitab Workspace, Minitab Simul8
Solution
The healthcare facility utilized process maps and value stream maps in Minitab Workspace to assist in optimizing healthcare processes, reducing inefficiencies, and mitigating risks. By mapping the process, the facility was able to identify bottlenecks and areas for improvement. Minitab Simul8 was used to simulate future bed availability to reduce backups in the ED. This simulation helped in understanding the impact of various changes and optimizing resource allocation to achieve better performance.
Results
With ongoing cost reductions and other restrictions within the healthcare environment, resources are becoming increasingly precious and scarce. Tools like Simul8 ensure that the highest performance is achieved with the most reasonable allocation of resources. These improvements enhance patient experience and increase overall efficiency in the ED. John Hopkins created an ED simulation at Howard County Hospital, which was then used across the whole system to help in their quest for zero-wait EDs.
This simulation demonstrated a 16% reduction in Length of Stay (LOS) and a significant reduction in wait time from 61.8 minutes to 16.2 minutes. These improvements enabled faster patient flow, reduced wait times, and optimized resource allocation, moving the institution significantly closer to its zero‑wait ED goal. The simulation insights also supported strategic infrastructure decisions, informing capacity planning for a $40 million ED expansion at Bayview Medical Center.
- 16% reduction: decrease in patient Length of Stay (LOS) in the ED
- 61.8 minutes to 16.2 minutes: reduction in average ED wait times
- $40M expansion: simulation insights supported capacity planning for Bayview Medical Center
Reducing Patient Wait Times for Lab Results
Challenge
Reducing patient wait times for lab results is crucial because timely results are essential for accurate diagnosis and effective treatment. Physicians need reliable wait time estimates, but the variability in wait times is excessive, and it takes too long to obtain results. This delay can lead to prolonged patient anxiety, delayed treatment decisions, and overall inefficiency in healthcare delivery.
Products
Minitab Statistical Software, Minitab Simul8
Solution
The diagnostic lab first collected baseline data to evaluate current performance relative to their wait time KPIs. Minitab enabled comprehensive analysis of patient data to identify trends and patterns, aiding in informed decision-making. The Minitab Assistant guided users to the most appropriate statistical analysis, providing results in natural language and performing automatic assumption checks.
To address the challenge, the lab simulated the effect of adding two new diagnostic machines using Minitab Simul8. The simulation determined that the current machines were not working at maximum capacity, and the bottlenecks were caused by not keeping enough “buffer stock” in the lab equipment, rather than a shortage of lab equipment.
Results
By identifying the true cause of the bottlenecks, the hospital avoided unnecessary purchases of additional equipment, saving roughly $45,000. Simple data analysis showed that the hospital was not keeping up with lab requests due to inefficient use of existing resources. Implementing changes based on these insights significantly reduced patient wait times for lab results, improving overall patient care, operational efficiency, and cost savings.
- $45K saved: avoided unnecessary purchase of additional lab equipment
- Reduced wait times: faster lab results through efficient use of existing resources
- Improved operational efficiency: better utilization of equipment and resources without new capital investment
Predictive Maintenance in Oil and Gas
Challenge
An oil and gas company is interested in identifying patterns in variables such as corrosion rate, vibration levels, and pressure that typically precede maintenance events. This allows for early intervention, reducing unplanned downtime and preventing costly equipment failures.
Products
Minitab Statistical Software, Minitab Connect, Predictive Analytics Module
Solution
Automated machine learning in the Predictive Analytics module allows analysts to determine which conditions are likely to lead to an unplanned maintenance issue out in the field. Using Minitab Connect, important variables can be monitored in real time with alerts automatically sent when processes fall out of control.
Results
Predictive maintenance analytics in oil and gas can lead to multi-million-dollar annual savings, increased asset reliability, and safer, more sustainable operations. The cost of unplanned downtime is $100,000–$300,000 per hour for offshore rigs and $20,000–$50,000 per hour for onshore refining units. A predictive model preventing just one major failure can save millions annually by avoiding several hours or days of downtime. Predictive analytics can reduce maintenance costs by 20–30%, translating to $1–$3 million annually for a large refinery. Extending the life of critical assets (e.g., compressors, pumps) by even 1–2 years can save $500,000–$2 million per asset. Avoiding one major incident can prevent $10 million or more in fines, cleanup, and reputational damage.
- $100K–$300K per hour: cost of unplanned downtime on offshore rigs
- $20K–$50K per hour: cost of unplanned downtime on onshore refining units
- $1M–$3M annually: maintenance cost savings for a large refinery (20–30% reduction)
- $500K–$2M per asset: savings from extending life of critical equipment by 1–2 years
- $10M+ avoided: fines, cleanup, and reputational damage prevented by avoiding one major incident
Increasing ATM Traffic
Challenge
Improving the customer experience at ATMs is known to increase usage, result in higher customer satisfaction, and improve financial performance for a bank. Analysts want to determine whether installing surrounds around the bank’s ATMs will increase their traffic.
Products
Minitab Statistical Software, Minitab Engage
Solution
Minitab Engage tracks the progress and financial benefits of continuous improvement (CI) projects throughout the organization. Minitab Assistant helps analysts determine the correct tool for analyzing ATM data and provides results in natural language for better understanding of conclusions.
Results
By implementing ATM surrounds, the bank achieved a measurable increase in traffic, customer satisfaction, and financial performance. Industry case studies show that ATM usage can increase by 20–30% with surrounds. For a bank operating 200 ATMs, each averaging 3,000 monthly transactions, this translates to approximately 150,000 additional transactions per month. At the 2025 average out-of-network ATM fee of $4.77 per transaction, this usage lift equates to about $715,500 in incremental fee revenue per month, or $8.6 million annually.
In addition to new fee revenue, the shift of transactions from tellers to ATMs generates significant labor savings. If just 5% of additional ATM transactions (7,500 per month) replace teller visits, and each teller transaction costs banks an average of $4 in labor, the bank saves around $30,000 per month, or $360,000 annually. Together, these outcomes demonstrate that surrounds are not just a customer-experience improvement but also a strong financial investment, with millions in revenue growth and hundreds of thousands in cost savings each year.
- 20%–30% increase: ATM usage uplift with surrounds
- 150K additional transactions per month: from 200 ATMs averaging 3,000 transactions each
- $715K per month / $8.6M annually: incremental ATM fee revenue at $4.77 per transaction
- $30K per month / $360K annually: labor savings from teller transaction replacement
How Teams Like Yours Achieve More with Minitab
From manufacturing to healthcare to financial services, discover how industry leaders drive measurable success with our solutions.
-
AutomotiveSeasonal Temperature Impact AnalysisChallenge
A chemical manufacturer was experiencing batch-to-batch variability and sought to identify the causes of these inconsistencies. They aimed to validate the theory that seasonal temperature changes in their region could impact production. Specifically, they wanted to determine whether the machine’s initial temperature was a contributing factor, since heating equipment in hot versus cold conditions might influence the process.
SolutionUsing Minitab SPC solutions (Real-Time SPC or Prolink), they smoothed the raw data with an EWMA chart to quickly identify when seasonal temperature affects production results. This chart helped validate the significance of initial machine temperature as a factor in production consistency and allowed personnel to make timely adjustments.ResultsThis discovery allowed them to consider temperature fluctuations in developing their production process and planning for manufacturing and shipping timelines. Following the data in real time using an EWMA chart allowed them to quickly make adjustments when ambient temperature came into play.
Inconsistent batches can result in scrap, rework, or regulatory non-compliance. Studies show that batch manufacturing losses due to variability can reach $500,000–$1 million annually for mid-sized chemical plants. Real-time Statistical Process Control (SPC) allows manufacturers to detect process drift early, reducing waste and improving responsiveness. A manufacturer processing 400,000 parts/year with a 4% scrap rate loses $160,000 annually. Reducing batch variability by 25–50% could save $40,000–$80,000 annually, depending on material costs and the extent of process improvement.$500K–$1MAnnually: Batch manufacturing losses due to variability in mid-sized chemical plants$160KAnnually: Losses from a 4% scrap rate at 400,000 parts/year$40K–$80KAnnually: Savings by reducing batch variability by 25–50% with SPC -
Medical Device & EquipmentEnsuring Precision in Intraocular Lens Injection SystemsChallengeIn cataract surgery, lenses are now often implanted using an intraocular lens injection system rather than forceps. The organization designed a syringe-like injector preloaded with the lens, allowing surgeons to use an automated implant mechanism. The force applied by the syringe must be carefully controlled to avoid damage.Solution
The organization followed a DMAIC process when developing the new injector. Several tools including t-tests were used to evaluate statistical differences in injector pressure between the old and new design.
Additionally, a two proportions test demonstrated that the proportion defective was reduced with the new design.
ResultsThe organization gained a better understanding of the performance of their new devices, ensuring they meet the necessary parameters. This confidence in their process and data continues to allow them to develop new and improved products.
In addition to these qualitative benefits, research on preloaded intraocular lens (IOL) injector systems shows measurable, tangible outcomes: surgeries save 30 seconds to over 1 minute per case, which compounds into 5–8% more throughput annually, equating to up to 1,440 additional surgeries per year. These efficiencies generate $284,000–$565,000 in additional revenue per facility each year, while also reducing contamination risks by eliminating unnecessary IOL touches and minimizing setup delays.
30s–1 min per case savedTime reduction with preloaded intraocular lens (IOL) injector systems5–8% more throughput annuallyUp to 1,440 additional surgeries per year$284K–$565K annuallyAdditional revenue per facility from efficiency gainsReduced contamination riskFewer IOL touches and setup delays, improving patient safety and efficiency -
PharmaceuticalsAutomated Drug Stability TestingChallengeA stability test assesses how a drug or product maintains its potency, purity, and quality over time under varying conditions such as temperature, humidity, and light. Pharmaceutical scientists use these tests to determine shelf life and guide storage, handling, and labeling instructions. These tests involve numerous variables across multiple batches and time points.Solution
Minitab Connect was configured to automatically read the latest data, manipulate it for analysis, run a stability study using Minitab Statistical Software, and report results back to the Connect Dashboard where the results could be shared with the US FDA.
ResultsThe time to generate each FDA stability report has dropped from several hours to fully automated, enabling immediate updates whenever new data becomes available. Industry-wide, such automation typically leads to a 40%–90% reduction in manual data entry errors, as well as a 40%+ increase in productivity thus freeing analysts to focus on higher-value tasks rather than repetitive reporting. Stability software also helps ensure strong regulatory compliance, maintains data integrity through audit trails, and delivers consistently formatted, submission-ready reports, minimizing risks of non-compliance or data integrity issues.
Several hours to automatedTime to generate each FDA stability report reduced to real time40%–90% reductionFewer manual data entry errors through automation40%+ increaseProductivity gain, freeing analysts for higher-value workReduced compliance riskSubmission-ready reports and audit trails minimize costly errors -
Food & BeverageBottling Plant Quality ImprovementChallengeA bottling plant Quality Engineer struggles with inconsistent product quality due to reactive problem-solving. Issues like fill levels that are too low or too high, misaligned labels, and inconsistent carbonation are often identified after significant scrap and rework have occurred, leading to lost time and money. Outdated reports and manual data compilation hinder timely identification of root causes.Solution
Minitab Real-Time SPC and Prolink provides instant visibility into production data, enabling the Quality Engineer to detect deviations in fill levels, carbonation, and capping processes in real time. Control charts alert to shifts and trends, allowing for proactive intervention before defects accumulate. Integrated with Minitab Statistical Software, the Quality Engineer can perform advanced analysis directly from the Real-Time SPC dashboard.
ResultsBy implementing Minitab SPC solutions, the bottling plant achieved dramatic reductions in scrap and rework, enabling early detection and correction of process deviations. This led to improved fill-level consistency, reduced downtime, and fewer customer complaints, all of which translated into measurable cost savings and enhanced customer satisfaction.
Industry research shows that beverage plants typically lose 1–3% of production to scrap and rework, which can cost $500,000–$1.5M annually for a mid-sized bottling facility producing ~200M bottles per year. Real-time SPC solutions have been shown to cut scrap and rework by 50–90%, reducing escaped defects from 8% to just 0.5%. For a plant with annual scrap costs of $1M, this translates into $500,000–$900,000 in savings per year. In addition, reduced downtime and fewer complaints lower warranty claims and protect brand reputation, further improving financial performance.$500K–$1.5M annuallyTypical scrap and rework losses for a mid-sized bottling plant50%–90% reductionScrap and rework savings possible with Real-Time SPC$500K–$900K annuallySavings per year for a plant with $1M scrap costs8% to 0.5%Reduction in escaped defects with real-time monitoring -
HospitalsReducing Time in the Emergency Department (ED)ChallengeReducing time in the Emergency Department (ED) is essential to identify bottlenecks, reduce wait times, improve resource allocation, enhance patient experience, and increase efficiency. Effective management of ED processes is crucial for providing timely care and optimizing the use of healthcare resources.Solution
The healthcare facility used process and value stream maps in Minitab Workspace to optimize processes, reduce inefficiencies, and mitigate risks. By mapping workflows, the facility identified bottlenecks and areas for improvement. Minitab Simul8 was then used to simulate future bed availability, helping reduce ED backups and optimize resource allocation for improved performance.
ResultsWith ongoing cost reductions and other restrictions within the healthcare environment, resources are becoming increasingly precious and scarce. Tools like Simul8 ensure that the highest performance is achieved with the most reasonable allocation of resources. These improvements enhance patient experience and increase overall efficiency in the ED. John Hopkins created an ED simulation at Howard County Hospital, which was then used across the whole system to help in their quest for zero-wait EDs.
This simulation demonstrated a 16% reduction in Length of Stay (LOS) and a significant reduction in wait time from 61.8 minutes to 16.2 minutes. These improvements enabled faster patient flow, reduced wait times, and optimized resource allocation, moving the institution significantly closer to its zero‑wait ED goal. The simulation insights also supported strategic infrastructure decisions, informing capacity planning for a $40 million ED expansion at Bayview Medical Center.
16% reductionDecrease in patient Length of Stay (LOS) in the ED61.8 minutes to 16.2 minutesReduction in average ED wait times$40M expansionSimulation insights supported capacity planning for Bayview Medical Center -
LabReducing Patient Wait Times for Lab ResultsChallengeReducing patient wait times for lab results is crucial because timely results are essential for accurate diagnosis and effective treatment. Physicians need reliable wait time estimates, but the variability in wait times is excessive, and it takes too long to obtain results. This delay can lead to prolonged patient anxiety, delayed treatment decisions, and overall inefficiency in healthcare delivery.Solution
The diagnostic lab first collected baseline data to evaluate current performance relative to their wait time KPIs. Minitab enabled comprehensive analysis of patient data to identify trends and patterns, aiding in informed decision-making. The Minitab Assistant guided users to the most appropriate statistical analysis, providing results in natural language and performing automatic assumption checks.
ResultsTo address the challenge, the lab simulated the effect of adding two new diagnostic machines using Minitab Simul8. The simulation determined that the current machines were not working at maximum capacity, and the bottlenecks were caused by not keeping enough “buffer stock” in the lab equipment, rather than a shortage of lab equipment.
By identifying the true cause of the bottlenecks, the hospital avoided unnecessary purchases of additional equipment, saving roughly $45,000. Simple data analysis showed that the hospital was not keeping up with lab requests due to inefficient use of existing resources. Implementing changes based on these insights significantly reduced patient wait times for lab results, improving overall patient care, operational efficiency, and cost savings.
$45K savedAvoided unnecessary purchase of additional lab equipmentReduced wait timesFaster lab results through efficient use of existing resourcesImproved operational efficiencyBetter utilization of equipment and resources without new capital investment -
Oil & GasPredictive Maintenance in Oil and GasChallengeAn oil and gas company is interested in identifying patterns in variables such as corrosion rate, vibration levels, and pressure that typically precede maintenance events. This allows for early intervention, reducing unplanned downtime and preventing costly equipment failures.Solution
Automated machine learning in the Predictive Analytics module allows analysts to determine which conditions are likely to lead to an unplanned maintenance issue out in the field. Using Minitab Connect, important variables can be monitored in real time with alerts automatically sent when processes fall out of control.
ResultsPredictive maintenance analytics in oil and gas can lead to multi-million-dollar annual savings, increased asset reliability, and safer, more sustainable operations. The cost of unplanned downtime is $100,000–$300,000 per hour for offshore rigs and $20,000–$50,000 per hour for onshore refining units. A predictive model preventing just one major failure can save millions annually by avoiding several hours or days of downtime. Predictive analytics can reduce maintenance costs by 20–30%, translating to $1–$3 million annually for a large refinery. Extending the life of critical assets (e.g., compressors, pumps) by even 1–2 years can save $500,000–$2 million per asset. Avoiding one major incident can prevent $10 million or more in fines, cleanup, and reputational damage.
$100K–$300K per hourCost of unplanned downtime on offshore rigs$20K–$50K per hourCost of unplanned downtime on onshore refining units$1M–$3M annuallyMaintenance cost savings for a large refinery (20–30% reduction)$500K–$2M per assetSavings from extending life of critical equipment by 1–2 years$10M+ avoidedFines, cleanup, and reputational damage prevented by avoiding one major incident -
FinanceIncreasing ATM TrafficChallengeImproving the customer experience at ATMs is known to increase usage, result in higher customer satisfaction, and improve financial performance for a bank. Analysts want to determine whether installing surrounds around the bank’s ATMs will increase their traffic.Solution
Minitab Engage tracks the progress and financial benefits of continuous improvement (CI) projects throughout the organization. Minitab Assistant helps analysts determine the correct tool for analyzing ATM data and provides results in natural language for better understanding of conclusions.
ResultsBy implementing ATM surrounds, the bank saw measurable gains in traffic, customer satisfaction, and financial performance. Industry case studies show ATM usage can rise 20–30% with surrounds. For a bank operating 200 ATMs averaging 3,000 monthly transactions, this translates to roughly 150,000 more transactions per month, worth about $715,000 in additional monthly fee revenue or $8.6 million annually at the 2025 average fee of $4.77 per transaction.
Shifting even 5% of those transactions from tellers to ATMs adds $30,000 in monthly labor savings, about $360,000 annually. Overall, ATM surrounds deliver not only a better customer experience but also strong financial returns through millions in new revenue and significant cost savings.
20%–30% increaseATM usage uplift with surrounds150K additional transactions per monthFrom 200 ATMs averaging 3,000 transactions each$715K per month / $8.6M annuallyIncremental ATM fee revenue at $4.77 per transaction$30K per month / $360K annuallyLabor savings from teller transaction replacement
Seasonal Temperature Impact Analysis
Challenge
A chemical manufacturer was experiencing batch-to-batch variability and sought to identify the causes of these inconsistencies. They aimed to validate the theory that seasonal temperature changes in their region could impact production. Specifically, they wanted to determine whether the machine’s initial temperature was a contributing factor, since heating equipment in hot versus cold conditions might influence the process.
Solution
Results
Inconsistent batches can result in scrap, rework, or regulatory non-compliance. Studies show that batch manufacturing losses due to variability can reach $500,000–$1 million annually for mid-sized chemical plants. Real-time Statistical Process Control (SPC) allows manufacturers to detect process drift early, reducing waste and improving responsiveness. A manufacturer processing 400,000 parts/year with a 4% scrap rate loses $160,000 annually. Reducing batch variability by 25–50% could save $40,000–$80,000 annually, depending on material costs and the extent of process improvement.
Ensuring Precision in Intraocular Lens Injection Systems
Challenge
Solution
The organization followed a DMAIC process when developing the new injector. Several tools including t-tests were used to evaluate statistical differences in injector pressure between the old and new design.
Additionally, a two proportions test demonstrated that the proportion defective was reduced with the new design.
Results
The organization gained a better understanding of the performance of their new devices, ensuring they meet the necessary parameters. This confidence in their process and data continues to allow them to develop new and improved products.
In addition to these qualitative benefits, research on preloaded intraocular lens (IOL) injector systems shows measurable, tangible outcomes: surgeries save 30 seconds to over 1 minute per case, which compounds into 5–8% more throughput annually, equating to up to 1,440 additional surgeries per year. These efficiencies generate $284,000–$565,000 in additional revenue per facility each year, while also reducing contamination risks by eliminating unnecessary IOL touches and minimizing setup delays.
Automated Drug Stability Testing
Challenge
Solution
Minitab Connect was configured to automatically read the latest data, manipulate it for analysis, run a stability study using Minitab Statistical Software, and report results back to the Connect Dashboard where the results could be shared with the US FDA.
Results
The time to generate each FDA stability report has dropped from several hours to fully automated, enabling immediate updates whenever new data becomes available. Industry-wide, such automation typically leads to a 40%–90% reduction in manual data entry errors, as well as a 40%+ increase in productivity thus freeing analysts to focus on higher-value tasks rather than repetitive reporting. Stability software also helps ensure strong regulatory compliance, maintains data integrity through audit trails, and delivers consistently formatted, submission-ready reports, minimizing risks of non-compliance or data integrity issues.
Bottling Plant Quality Improvement
Challenge
Solution
Minitab Real-Time SPC and Prolink provides instant visibility into production data, enabling the Quality Engineer to detect deviations in fill levels, carbonation, and capping processes in real time. Control charts alert to shifts and trends, allowing for proactive intervention before defects accumulate. Integrated with Minitab Statistical Software, the Quality Engineer can perform advanced analysis directly from the Real-Time SPC dashboard.
Results
By implementing Minitab SPC solutions, the bottling plant achieved dramatic reductions in scrap and rework, enabling early detection and correction of process deviations. This led to improved fill-level consistency, reduced downtime, and fewer customer complaints, all of which translated into measurable cost savings and enhanced customer satisfaction.
Industry research shows that beverage plants typically lose 1–3% of production to scrap and rework, which can cost $500,000–$1.5M annually for a mid-sized bottling facility producing ~200M bottles per year. Real-time SPC solutions have been shown to cut scrap and rework by 50–90%, reducing escaped defects from 8% to just 0.5%. For a plant with annual scrap costs of $1M, this translates into $500,000–$900,000 in savings per year. In addition, reduced downtime and fewer complaints lower warranty claims and protect brand reputation, further improving financial performance.
Reducing Time in the Emergency Department (ED)
Challenge
Solution
The healthcare facility used process and value stream maps in Minitab Workspace to optimize processes, reduce inefficiencies, and mitigate risks. By mapping workflows, the facility identified bottlenecks and areas for improvement. Minitab Simul8 was then used to simulate future bed availability, helping reduce ED backups and optimize resource allocation for improved performance.
Results
With ongoing cost reductions and other restrictions within the healthcare environment, resources are becoming increasingly precious and scarce. Tools like Simul8 ensure that the highest performance is achieved with the most reasonable allocation of resources. These improvements enhance patient experience and increase overall efficiency in the ED. John Hopkins created an ED simulation at Howard County Hospital, which was then used across the whole system to help in their quest for zero-wait EDs.
This simulation demonstrated a 16% reduction in Length of Stay (LOS) and a significant reduction in wait time from 61.8 minutes to 16.2 minutes. These improvements enabled faster patient flow, reduced wait times, and optimized resource allocation, moving the institution significantly closer to its zero‑wait ED goal. The simulation insights also supported strategic infrastructure decisions, informing capacity planning for a $40 million ED expansion at Bayview Medical Center.
Reducing Patient Wait Times for Lab Results
Challenge
Solution
The diagnostic lab first collected baseline data to evaluate current performance relative to their wait time KPIs. Minitab enabled comprehensive analysis of patient data to identify trends and patterns, aiding in informed decision-making. The Minitab Assistant guided users to the most appropriate statistical analysis, providing results in natural language and performing automatic assumption checks.
Results
To address the challenge, the lab simulated the effect of adding two new diagnostic machines using Minitab Simul8. The simulation determined that the current machines were not working at maximum capacity, and the bottlenecks were caused by not keeping enough “buffer stock” in the lab equipment, rather than a shortage of lab equipment.
By identifying the true cause of the bottlenecks, the hospital avoided unnecessary purchases of additional equipment, saving roughly $45,000. Simple data analysis showed that the hospital was not keeping up with lab requests due to inefficient use of existing resources. Implementing changes based on these insights significantly reduced patient wait times for lab results, improving overall patient care, operational efficiency, and cost savings.
Predictive Maintenance in Oil and Gas
Challenge
Solution
Automated machine learning in the Predictive Analytics module allows analysts to determine which conditions are likely to lead to an unplanned maintenance issue out in the field. Using Minitab Connect, important variables can be monitored in real time with alerts automatically sent when processes fall out of control.
Results
Predictive maintenance analytics in oil and gas can lead to multi-million-dollar annual savings, increased asset reliability, and safer, more sustainable operations. The cost of unplanned downtime is $100,000–$300,000 per hour for offshore rigs and $20,000–$50,000 per hour for onshore refining units. A predictive model preventing just one major failure can save millions annually by avoiding several hours or days of downtime. Predictive analytics can reduce maintenance costs by 20–30%, translating to $1–$3 million annually for a large refinery. Extending the life of critical assets (e.g., compressors, pumps) by even 1–2 years can save $500,000–$2 million per asset. Avoiding one major incident can prevent $10 million or more in fines, cleanup, and reputational damage.
Increasing ATM Traffic
Challenge
Solution
Minitab Engage tracks the progress and financial benefits of continuous improvement (CI) projects throughout the organization. Minitab Assistant helps analysts determine the correct tool for analyzing ATM data and provides results in natural language for better understanding of conclusions.
Results
By implementing ATM surrounds, the bank saw measurable gains in traffic, customer satisfaction, and financial performance. Industry case studies show ATM usage can rise 20–30% with surrounds. For a bank operating 200 ATMs averaging 3,000 monthly transactions, this translates to roughly 150,000 more transactions per month, worth about $715,000 in additional monthly fee revenue or $8.6 million annually at the 2025 average fee of $4.77 per transaction.
Shifting even 5% of those transactions from tellers to ATMs adds $30,000 in monthly labor savings, about $360,000 annually. Overall, ATM surrounds deliver not only a better customer experience but also strong financial returns through millions in new revenue and significant cost savings.
Seasonal Temperature Impact Analysis
Challenge
A chemical manufacturer was experiencing variability in results from batch to batch and sought to find reasons for these inconsistent results. They aimed to validate the theory that seasonal temperature changes in their geographic area could affect production. Specifically, they needed to determine if the initial temperature of the machine was a valid factor, as heating something up when it is already hot out versus when it is cold out might affect the process.
Products
Minitab Real-Time SPC and Minitab Prolink
Solution
Using Minitab SPC solutions (Real-Time SPC or Prolink), they smoothed the raw data with an EWMA chart to quickly identify when seasonal temperature affects production results. This chart helped validate the significance of initial machine temperature as a factor in production consistency and allowed personnel to make timely adjustments.
Results
This discovery allowed them to consider temperature fluctuations in developing their production process and planning for manufacturing and shipping timelines. The analysis confirmed that initial temperature is a factor to be considered, aiding in resolving batch variability issues. Following the data in real time using an EWMA chart allowed them to quickly make adjustments when ambient temperature came into play.
Inconsistent batches can result in scrap, rework, or regulatory non-compliance. Studies show that batch manufacturing losses due to variability can reach $500,000–$1 million annually for mid-sized chemical plants. Real-time Statistical Process Control (SPC) tools allow manufacturers to detect process drift early, reducing waste and improving responsiveness. A manufacturer processing 400,000 parts/year with a 4% scrap rate loses $160,000 annually. Reducing batch variability by 25–50% could save $40,000–$80,000 annually, depending on material costs and the extent of process improvement.
- $500K–$1M annually: batch manufacturing losses due to variability in mid-sized chemical plants
- $160K annually: losses from a 4% scrap rate at 400,000 parts/year
- $40K–$80K annually: savings by reducing batch variability by 25–50% with SPC
Ensuring Precision in Intraocular Lens Injection Systems
Challenge
In cataract surgery, lenses are now often implanted using an intraocular lens injection system rather than forceps. The organization designed a syringe-like injector preloaded with the lens, allowing surgeons to use an automated implant mechanism. The force applied by the syringe must be carefully controlled to avoid damage.
Products
Minitab Statistical Software, Minitab Engage
Solutions
The organization followed a DMAIC process when developing the new injector. Several tools including t-tests were used to evaluate statistical differences in injector pressure between the old and new design.
Additionally, a two proportions test demonstrated that the proportion defective was reduced with the new design.
Results
The organization gained a better understanding of the performance of their new devices, ensuring they meet the necessary parameters. This confidence in their process and data continues to allow them to develop new and improved products.
In addition to these qualitative benefits, research on preloaded intraocular lens (IOL) injector systems shows measurable, tangible outcomes: surgeries save 30 seconds to over 1 minute per case, which compounds into 5–8% more throughput annually, equating to up to 1,440 additional surgeries per year. These efficiencies generate $284,000–$565,000 in additional revenue per facility each year, while also reducing contamination risks by eliminating unnecessary IOL touches and minimizing setup delays.
- 30s–1 min per case saved: time reduction with preloaded intraocular lens (IOL) injector systems
- 5–8% more throughput annually: up to 1,440 additional surgeries per year
- $284K–$565K annually: additional revenue per facility from efficiency gains
- Reduced contamination risk: fewer IOL touches and setup delays, improving patient safety and efficiency
Automated Drug Stability Testing
Challenge
A stability test evaluates how a drug or product maintains its potency, purity, and quality over time under various conditions like temperature, humidity, and light. Scientists in the pharmaceutical industry use these tests to determine product shelf life as well as to guide proper storage, handling, and labeling instructions. Because the same tests are run on many variables across multiple batches and lots at multiple time points, automating this work is key to efficiency.
Products
Minitab Statistical Software, Minitab Connect
Solution
Minitab Connect was configured to automatically read the latest data, manipulate it for analysis, run a stability study using Minitab Statistical Software, and report results back to the Connect Dashboard where the results could be shared with the US FDA.
Results
The time to generate each FDA stability report has dropped from several hours to fully automated, enabling immediate updates whenever new data becomes available. Industry-wide, such automation typically leads to a 40%–90% reduction in manual data entry errors, as well as a 40%+ increase in productivity thus freeing analysts to focus on higher-value tasks rather than repetitive reporting. Stability software also helps ensure strong regulatory compliance, maintains data integrity through audit trails, and delivers consistently formatted, submission-ready reports, minimizing risks of non-compliance or data integrity issues.
- Several hours to automated: time to generate each FDA stability report reduced to real time
- 40%–90% reduction: fewer manual data entry errors through automation
- 40%+ increase: productivity gain, freeing analysts for higher-value work
- Reduced compliance risk: submission-ready reports and audit trails minimize costly errors
Bottling Plant Quality Improvement
Challenge
A bottling plant Quality Engineer struggles with inconsistent product quality due to reactive problem-solving. Issues like fill levels that are too low or too high, misaligned labels, and inconsistent carbonation are often identified after significant scrap and rework have occurred, leading to lost time and money. Outdated reports and manual data compilation hinder timely identification of root causes.
Products
Minitab Statistical Software, Minitab Real-Time SPC and Minitab Prolink
Solution
Minitab Real-Time SPC and Prolink provides instant visibility into production data, enabling the Quality Engineer to detect deviations in fill levels, carbonation, and capping processes in real time. Control charts alert to shifts and trends, allowing for proactive intervention before defects accumulate. Integrated with Minitab Statistical Software, the Quality Engineer can perform advanced analysis directly from the Real-Time SPC dashboard.
Results
By implementing Minitab SPC solutions, the bottling plant achieved dramatic reductions in scrap and rework, enabling early detection and correction of process deviations. This led to improved fill-level consistency, reduced downtime, and fewer customer complaints, all of which translated into measurable cost savings and enhanced customer satisfaction.
Industry research shows that beverage plants typically lose 1–3% of production to scrap and rework, which can cost $500,000–$1.5M annually for a mid-sized bottling facility producing ~200M bottles per year. Real-time SPC solutions have been shown to cut scrap and rework by 50–90%, reducing escaped defects from 8% to just 0.5%. For a plant with annual scrap costs of $1M, this translates into $500,000–$900,000 in savings per year. In addition, reduced downtime and fewer complaints lower warranty claims and protect brand reputation, further improving financial performance.
- $500K–$1.5M annually: typical scrap and rework losses for a mid-sized bottling plant
- 50%–90% reduction: scrap and rework savings possible with Real-Time SPC
- $500K–$900K annually: savings per year for a plant with $1M scrap costs
- 8% to 0.5%: reduction in escaped defects with real-time monitoring
Reducing Time in the Emergency Department (ED)
Challenge
Reducing time in the Emergency Department (ED) is essential to identify bottlenecks, reduce wait times, improve resource allocation, enhance patient experience, and increase efficiency. Effective management of ED processes is crucial for providing timely care and optimizing the use of healthcare resources.
Products
Minitab Workspace, Minitab Simul8
Solution
The healthcare facility utilized process maps and value stream maps in Minitab Workspace to assist in optimizing healthcare processes, reducing inefficiencies, and mitigating risks. By mapping the process, the facility was able to identify bottlenecks and areas for improvement. Minitab Simul8 was used to simulate future bed availability to reduce backups in the ED. This simulation helped in understanding the impact of various changes and optimizing resource allocation to achieve better performance.
Results
With ongoing cost reductions and other restrictions within the healthcare environment, resources are becoming increasingly precious and scarce. Tools like Simul8 ensure that the highest performance is achieved with the most reasonable allocation of resources. These improvements enhance patient experience and increase overall efficiency in the ED. John Hopkins created an ED simulation at Howard County Hospital, which was then used across the whole system to help in their quest for zero-wait EDs.
This simulation demonstrated a 16% reduction in Length of Stay (LOS) and a significant reduction in wait time from 61.8 minutes to 16.2 minutes. These improvements enabled faster patient flow, reduced wait times, and optimized resource allocation, moving the institution significantly closer to its zero‑wait ED goal. The simulation insights also supported strategic infrastructure decisions, informing capacity planning for a $40 million ED expansion at Bayview Medical Center.
- 16% reduction: decrease in patient Length of Stay (LOS) in the ED
- 61.8 minutes to 16.2 minutes: reduction in average ED wait times
- $40M expansion: simulation insights supported capacity planning for Bayview Medical Center
Reducing Patient Wait Times for Lab Results
Challenge
Reducing patient wait times for lab results is crucial because timely results are essential for accurate diagnosis and effective treatment. Physicians need reliable wait time estimates, but the variability in wait times is excessive, and it takes too long to obtain results. This delay can lead to prolonged patient anxiety, delayed treatment decisions, and overall inefficiency in healthcare delivery.
Products
Minitab Statistical Software, Minitab Simul8
Solution
The diagnostic lab first collected baseline data to evaluate current performance relative to their wait time KPIs. Minitab enabled comprehensive analysis of patient data to identify trends and patterns, aiding in informed decision-making. The Minitab Assistant guided users to the most appropriate statistical analysis, providing results in natural language and performing automatic assumption checks.
To address the challenge, the lab simulated the effect of adding two new diagnostic machines using Minitab Simul8. The simulation determined that the current machines were not working at maximum capacity, and the bottlenecks were caused by not keeping enough “buffer stock” in the lab equipment, rather than a shortage of lab equipment.
Results
By identifying the true cause of the bottlenecks, the hospital avoided unnecessary purchases of additional equipment, saving roughly $45,000. Simple data analysis showed that the hospital was not keeping up with lab requests due to inefficient use of existing resources. Implementing changes based on these insights significantly reduced patient wait times for lab results, improving overall patient care, operational efficiency, and cost savings.
- $45K saved: avoided unnecessary purchase of additional lab equipment
- Reduced wait times: faster lab results through efficient use of existing resources
- Improved operational efficiency: better utilization of equipment and resources without new capital investment
Predictive Maintenance in Oil and Gas
Challenge
An oil and gas company is interested in identifying patterns in variables such as corrosion rate, vibration levels, and pressure that typically precede maintenance events. This allows for early intervention, reducing unplanned downtime and preventing costly equipment failures.
Products
Minitab Statistical Software, Minitab Connect, Predictive Analytics Module
Solution
Automated machine learning in the Predictive Analytics module allows analysts to determine which conditions are likely to lead to an unplanned maintenance issue out in the field. Using Minitab Connect, important variables can be monitored in real time with alerts automatically sent when processes fall out of control.
Results
Predictive maintenance analytics in oil and gas can lead to multi-million-dollar annual savings, increased asset reliability, and safer, more sustainable operations. The cost of unplanned downtime is $100,000–$300,000 per hour for offshore rigs and $20,000–$50,000 per hour for onshore refining units. A predictive model preventing just one major failure can save millions annually by avoiding several hours or days of downtime. Predictive analytics can reduce maintenance costs by 20–30%, translating to $1–$3 million annually for a large refinery. Extending the life of critical assets (e.g., compressors, pumps) by even 1–2 years can save $500,000–$2 million per asset. Avoiding one major incident can prevent $10 million or more in fines, cleanup, and reputational damage.
- $100K–$300K per hour: cost of unplanned downtime on offshore rigs
- $20K–$50K per hour: cost of unplanned downtime on onshore refining units
- $1M–$3M annually: maintenance cost savings for a large refinery (20–30% reduction)
- $500K–$2M per asset: savings from extending life of critical equipment by 1–2 years
- $10M+ avoided: fines, cleanup, and reputational damage prevented by avoiding one major incident
Increasing ATM Traffic
Challenge
Improving the customer experience at ATMs is known to increase usage, result in higher customer satisfaction, and improve financial performance for a bank. Analysts want to determine whether installing surrounds around the bank’s ATMs will increase their traffic.
Products
Minitab Statistical Software, Minitab Engage
Solution
Minitab Engage tracks the progress and financial benefits of continuous improvement (CI) projects throughout the organization. Minitab Assistant helps analysts determine the correct tool for analyzing ATM data and provides results in natural language for better understanding of conclusions.
Results
By implementing ATM surrounds, the bank achieved a measurable increase in traffic, customer satisfaction, and financial performance. Industry case studies show that ATM usage can increase by 20–30% with surrounds. For a bank operating 200 ATMs, each averaging 3,000 monthly transactions, this translates to approximately 150,000 additional transactions per month. At the 2025 average out-of-network ATM fee of $4.77 per transaction, this usage lift equates to about $715,500 in incremental fee revenue per month, or $8.6 million annually.
In addition to new fee revenue, the shift of transactions from tellers to ATMs generates significant labor savings. If just 5% of additional ATM transactions (7,500 per month) replace teller visits, and each teller transaction costs banks an average of $4 in labor, the bank saves around $30,000 per month, or $360,000 annually. Together, these outcomes demonstrate that surrounds are not just a customer-experience improvement but also a strong financial investment, with millions in revenue growth and hundreds of thousands in cost savings each year.
- 20%–30% increase: ATM usage uplift with surrounds
- 150K additional transactions per month: from 200 ATMs averaging 3,000 transactions each
- $715K per month / $8.6M annually: incremental ATM fee revenue at $4.77 per transaction
- $30K per month / $360K annually: labor savings from teller transaction replacement
Beyond Point Solutions & Toward Complete Performance.
















Trusted by Over 90% of the Fortune 100
For over 50 years, Minitab has earned the loyalty of organizations across every industry, size, and geography. Our customers share one goal: a commitment to excellence. We’re dedicated to helping them achieve it.










Voices From Across Our Customer Community
From efficiency gains to financial impact, organizations consistently share how Minitab drives results that matter.

Shaik C.
Data Analyst | G2

Minitab Connect is a powerful platform!
It’s the universal translator for data—pulling from Excel sheets, SQL databases, cloud platforms, and even IoT devices, all into one workspace. That kind of connectivity makes wrangling data feel... surprisingly elegant.
Daniel P.
LSS Black Belt and APEX Deployment Leader | G2

Minitab Engage is a very intuitive and user-friendly platform.
The platform is very easy to learn and navigate. It allows me to manage the Project Pipeline with simple navigation through main stages (Idea, Hopper, Active). The high level of freedom on filters and sorting makes finding projects very efficient.

Kristina N.
Industrial Engineer II | Capterra
.png)
Ease of use and WONDERFUL customer experience!
10/10 - I would purchase again. I also took the training with customer service rep and that unlocked my use of the tool more than if I were to just buy and use without going. Both the reps are the two employees I interface with most and I can't say enough positive things about my experience as a customer and user. I feel their attitude towards the product to truly help my decision making.
Joel D.
Lean Specialist | Capterra
Essential...
The ability to incorporate all the tools needed to manage a project, whether it be a small JDI, a kaizen event or a lengthy DMAIC project, all in one place is really convenient: time study data, process flow mapping, and VSM's. I was also able to create a yamazumi chart template in order to balance our departments.
Patrik T.
Application Specialist | Capterra
With Simul8, there is virtually nothing that can not be built and simulated.
It is easy to learn the basics and create simple simulations, yet the software has so much depth, there's virtually nothing that can not be built and simulated.
Verified User
Manufacturing

A must have for quality control and process improvement.
Minitab is an excellent statistical software that simplifies complex data analysis. It’s intuitive interface makes it easy for beginners, while advanced users can leverage powerful tools like regression, ANOVA, and control charts. and training. I especially appreciate its strong integration with quality improvement methodologies like Six Sigma and Lean. Overall, a must-have for anyone serious about quality control and data-driven decision-making.
Gerald B.
Health, Wellness and Fitness Owner | G2
Efficient Data Transformation & Automation
They have a great interface that enables me to alter data even without any coding knowledge. I can automate data reporting with Minitab Connect which speeds up my job. My company's production expenses are decreased as a consequence of Minitab Connect's streamlined processes and assistance in removing mistakes like under-filling or overfilling. It provides strong tools for designing aesthetically appealing and expert charts, improving data analysis skills.
Tommy H.
Continuous Improvement Engineer
Minitab - Still happy to still use it after 20 years
I started out using Minitab in 2004 after a frustrating time trying to build boxplots for my quality test data in Excel. My manager had just attended Six Sigma training and showed me Minitab, which I self-taught into building Boxplots of quality data that were much more meaningful than average data points. From there I learned how to perform hypothesis tests, build control charts and use ANOVA to determine shifts in process behavior as I have changed jobs and locations. Minitab = Statistics made EASY!
Take the Next Step with Minitab
Whether you’re exploring next steps or ready to get started, we’ll help you take the next step and find the right solution for your business.