
데이터로 성과를 만드는 글로벌 리더들의 선택
더 스마트한 의사결정에서부터 위험을 줄이면서 성과를 더욱 빠르게 내는 일까지, 기업들은 매일 복잡한 과제를 마주하게 됩니다. 세계 최고의 팀들은 데이터가 측정 가능하고 지속적인 성과를 만드는 핵심임을 알고 있습니다.
바로 그 지점에서 Minitab이 역할을 합니다.
수십 년간 검증된 전문성을 바탕으로, Minitab은 글로벌 리더들이 신뢰하는
종합 분석 및 프로세스 개선 솔루션을 제공합니다.
기회 발굴과 데이터 관리부터 품질 모니터링, 결과 시뮬레이션까지
통합된 플랫폼을 통해 확신 있는 성과 달성을 지원합니다.
전 세계 팀들이 Minitab으로 어떻게 성과를 혁신하고 있는지 확인해 보세요.

Minitab이 만들어내는 측정 가능한 변화
선도적인 팀들은 단순히 Minitab을 신뢰하는 데 그치지 않습니다. 시간, 비용, 리스크, 그리고 ROI에서 분명한 성과를 확인합니다.
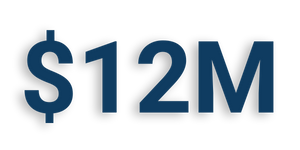
연간 비용 절감
효율성 향상과 자원 활용 최적화를 통해연간 1,200만 달러의 검증된 재무 효과를 달성했습니다.
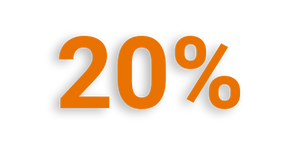
생산성 향상
Minitab을 사용하는 조직은 공정 처리량을 크게 개선하여 성과를 가속화하고 병목 현상을 줄였습니다.
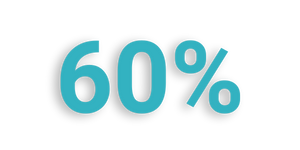
비용 절감
Minitab은 운영을 간소화하고 불필요한 비용을 제거하여즉각적이면서도 장기적인 절감 효과를 실현합니다.

매출 증가
Minitab을 통한 스마트한 의사결정은 100만 달러 이상의 신규 매출 창출로 이어집니다.
Seasonal Temperature Impact Analysis
Challenge
A chemical manufacturer was experiencing variability in results from batch to batch and sought to find reasons for these inconsistent results. They aimed to validate the theory that seasonal temperature changes in their geographic area could affect production. Specifically, they needed to determine if the initial temperature of the machine was a valid factor, as heating something up when it is already hot out versus when it is cold out might affect the process.
Products
Minitab Real-Time SPC and Minitab Prolink
Solution
Using Minitab SPC solutions (Real-Time SPC or Prolink), they smoothed the raw data with an EWMA chart to quickly identify when seasonal temperature affects production results. This chart helped validate the significance of initial machine temperature as a factor in production consistency and allowed personnel to make timely adjustments.
Results
This discovery allowed them to consider temperature fluctuations in developing their production process and planning for manufacturing and shipping timelines. The analysis confirmed that initial temperature is a factor to be considered, aiding in resolving batch variability issues. Following the data in real time using an EWMA chart allowed them to quickly make adjustments when ambient temperature came into play.
Inconsistent batches can result in scrap, rework, or regulatory non-compliance. Studies show that batch manufacturing losses due to variability can reach $500,000–$1 million annually for mid-sized chemical plants. Real-time Statistical Process Control (SPC) tools allow manufacturers to detect process drift early, reducing waste and improving responsiveness. A manufacturer processing 400,000 parts/year with a 4% scrap rate loses $160,000 annually. Reducing batch variability by 25–50% could save $40,000–$80,000 annually, depending on material costs and the extent of process improvement.
- $500K–$1M annually: batch manufacturing losses due to variability in mid-sized chemical plants
- $160K annually: losses from a 4% scrap rate at 400,000 parts/year
- $40K–$80K annually: savings by reducing batch variability by 25–50% with SPC
Ensuring Precision in Intraocular Lens Injection Systems
Challenge
In cataract surgery, lenses are now often implanted using an intraocular lens injection system rather than forceps. The organization designed a syringe-like injector preloaded with the lens, allowing surgeons to use an automated implant mechanism. The force applied by the syringe must be carefully controlled to avoid damage.
Products
Minitab Statistical Software, Minitab Engage
Solutions
The organization followed a DMAIC process when developing the new injector. Several tools including t-tests were used to evaluate statistical differences in injector pressure between the old and new design.
Additionally, a two proportions test demonstrated that the proportion defective was reduced with the new design.
Results
The organization gained a better understanding of the performance of their new devices, ensuring they meet the necessary parameters. This confidence in their process and data continues to allow them to develop new and improved products.
In addition to these qualitative benefits, research on preloaded intraocular lens (IOL) injector systems shows measurable, tangible outcomes: surgeries save 30 seconds to over 1 minute per case, which compounds into 5–8% more throughput annually, equating to up to 1,440 additional surgeries per year. These efficiencies generate $284,000–$565,000 in additional revenue per facility each year, while also reducing contamination risks by eliminating unnecessary IOL touches and minimizing setup delays.
- 30s–1 min per case saved: time reduction with preloaded intraocular lens (IOL) injector systems
- 5–8% more throughput annually: up to 1,440 additional surgeries per year
- $284K–$565K annually: additional revenue per facility from efficiency gains
- Reduced contamination risk: fewer IOL touches and setup delays, improving patient safety and efficiency
Automated Drug Stability Testing
Challenge
A stability test evaluates how a drug or product maintains its potency, purity, and quality over time under various conditions like temperature, humidity, and light. Scientists in the pharmaceutical industry use these tests to determine product shelf life as well as to guide proper storage, handling, and labeling instructions. Because the same tests are run on many variables across multiple batches and lots at multiple time points, automating this work is key to efficiency.
Products
Minitab Statistical Software, Minitab Connect
Solution
Minitab Connect was configured to automatically read the latest data, manipulate it for analysis, run a stability study using Minitab Statistical Software, and report results back to the Connect Dashboard where the results could be shared with the US FDA.
Results
The time to generate each FDA stability report has dropped from several hours to fully automated, enabling immediate updates whenever new data becomes available. Industry-wide, such automation typically leads to a 40%–90% reduction in manual data entry errors, as well as a 40%+ increase in productivity thus freeing analysts to focus on higher-value tasks rather than repetitive reporting. Stability software also helps ensure strong regulatory compliance, maintains data integrity through audit trails, and delivers consistently formatted, submission-ready reports, minimizing risks of non-compliance or data integrity issues.
- Several hours to automated: time to generate each FDA stability report reduced to real time
- 40%–90% reduction: fewer manual data entry errors through automation
- 40%+ increase: productivity gain, freeing analysts for higher-value work
- Reduced compliance risk: submission-ready reports and audit trails minimize costly errors
Bottling Plant Quality Improvement
Challenge
A bottling plant Quality Engineer struggles with inconsistent product quality due to reactive problem-solving. Issues like fill levels that are too low or too high, misaligned labels, and inconsistent carbonation are often identified after significant scrap and rework have occurred, leading to lost time and money. Outdated reports and manual data compilation hinder timely identification of root causes.
Products
Minitab Statistical Software, Minitab Real-Time SPC and Minitab Prolink
Solution
Minitab Real-Time SPC and Prolink provides instant visibility into production data, enabling the Quality Engineer to detect deviations in fill levels, carbonation, and capping processes in real time. Control charts alert to shifts and trends, allowing for proactive intervention before defects accumulate. Integrated with Minitab Statistical Software, the Quality Engineer can perform advanced analysis directly from the Real-Time SPC dashboard.
Results
By implementing Minitab SPC solutions, the bottling plant achieved dramatic reductions in scrap and rework, enabling early detection and correction of process deviations. This led to improved fill-level consistency, reduced downtime, and fewer customer complaints, all of which translated into measurable cost savings and enhanced customer satisfaction.
Industry research shows that beverage plants typically lose 1–3% of production to scrap and rework, which can cost $500,000–$1.5M annually for a mid-sized bottling facility producing ~200M bottles per year. Real-time SPC solutions have been shown to cut scrap and rework by 50–90%, reducing escaped defects from 8% to just 0.5%. For a plant with annual scrap costs of $1M, this translates into $500,000–$900,000 in savings per year. In addition, reduced downtime and fewer complaints lower warranty claims and protect brand reputation, further improving financial performance.
- $500K–$1.5M annually: typical scrap and rework losses for a mid-sized bottling plant
- 50%–90% reduction: scrap and rework savings possible with Real-Time SPC
- $500K–$900K annually: savings per year for a plant with $1M scrap costs
- 8% to 0.5%: reduction in escaped defects with real-time monitoring
Reducing Time in the Emergency Department (ED)
Challenge
Reducing time in the Emergency Department (ED) is essential to identify bottlenecks, reduce wait times, improve resource allocation, enhance patient experience, and increase efficiency. Effective management of ED processes is crucial for providing timely care and optimizing the use of healthcare resources.
Products
Minitab Workspace, Minitab Simul8
Solution
The healthcare facility utilized process maps and value stream maps in Minitab Workspace to assist in optimizing healthcare processes, reducing inefficiencies, and mitigating risks. By mapping the process, the facility was able to identify bottlenecks and areas for improvement. Minitab Simul8 was used to simulate future bed availability to reduce backups in the ED. This simulation helped in understanding the impact of various changes and optimizing resource allocation to achieve better performance.
Results
With ongoing cost reductions and other restrictions within the healthcare environment, resources are becoming increasingly precious and scarce. Tools like Simul8 ensure that the highest performance is achieved with the most reasonable allocation of resources. These improvements enhance patient experience and increase overall efficiency in the ED. John Hopkins created an ED simulation at Howard County Hospital, which was then used across the whole system to help in their quest for zero-wait EDs.
This simulation demonstrated a 16% reduction in Length of Stay (LOS) and a significant reduction in wait time from 61.8 minutes to 16.2 minutes. These improvements enabled faster patient flow, reduced wait times, and optimized resource allocation, moving the institution significantly closer to its zero‑wait ED goal. The simulation insights also supported strategic infrastructure decisions, informing capacity planning for a $40 million ED expansion at Bayview Medical Center.
- 16% reduction: decrease in patient Length of Stay (LOS) in the ED
- 61.8 minutes to 16.2 minutes: reduction in average ED wait times
- $40M expansion: simulation insights supported capacity planning for Bayview Medical Center
Reducing Patient Wait Times for Lab Results
Challenge
Reducing patient wait times for lab results is crucial because timely results are essential for accurate diagnosis and effective treatment. Physicians need reliable wait time estimates, but the variability in wait times is excessive, and it takes too long to obtain results. This delay can lead to prolonged patient anxiety, delayed treatment decisions, and overall inefficiency in healthcare delivery.
Products
Minitab Statistical Software, Minitab Simul8
Solution
The diagnostic lab first collected baseline data to evaluate current performance relative to their wait time KPIs. Minitab enabled comprehensive analysis of patient data to identify trends and patterns, aiding in informed decision-making. The Minitab Assistant guided users to the most appropriate statistical analysis, providing results in natural language and performing automatic assumption checks.
To address the challenge, the lab simulated the effect of adding two new diagnostic machines using Minitab Simul8. The simulation determined that the current machines were not working at maximum capacity, and the bottlenecks were caused by not keeping enough “buffer stock” in the lab equipment, rather than a shortage of lab equipment.
Results
By identifying the true cause of the bottlenecks, the hospital avoided unnecessary purchases of additional equipment, saving roughly $45,000. Simple data analysis showed that the hospital was not keeping up with lab requests due to inefficient use of existing resources. Implementing changes based on these insights significantly reduced patient wait times for lab results, improving overall patient care, operational efficiency, and cost savings.
- $45K saved: avoided unnecessary purchase of additional lab equipment
- Reduced wait times: faster lab results through efficient use of existing resources
- Improved operational efficiency: better utilization of equipment and resources without new capital investment
Predictive Maintenance in Oil and Gas
Challenge
An oil and gas company is interested in identifying patterns in variables such as corrosion rate, vibration levels, and pressure that typically precede maintenance events. This allows for early intervention, reducing unplanned downtime and preventing costly equipment failures.
Products
Minitab Statistical Software, Minitab Connect, Predictive Analytics Module
Solution
Automated machine learning in the Predictive Analytics module allows analysts to determine which conditions are likely to lead to an unplanned maintenance issue out in the field. Using Minitab Connect, important variables can be monitored in real time with alerts automatically sent when processes fall out of control.
Results
Predictive maintenance analytics in oil and gas can lead to multi-million-dollar annual savings, increased asset reliability, and safer, more sustainable operations. The cost of unplanned downtime is $100,000–$300,000 per hour for offshore rigs and $20,000–$50,000 per hour for onshore refining units. A predictive model preventing just one major failure can save millions annually by avoiding several hours or days of downtime. Predictive analytics can reduce maintenance costs by 20–30%, translating to $1–$3 million annually for a large refinery. Extending the life of critical assets (e.g., compressors, pumps) by even 1–2 years can save $500,000–$2 million per asset. Avoiding one major incident can prevent $10 million or more in fines, cleanup, and reputational damage.
- $100K–$300K per hour: cost of unplanned downtime on offshore rigs
- $20K–$50K per hour: cost of unplanned downtime on onshore refining units
- $1M–$3M annually: maintenance cost savings for a large refinery (20–30% reduction)
- $500K–$2M per asset: savings from extending life of critical equipment by 1–2 years
- $10M+ avoided: fines, cleanup, and reputational damage prevented by avoiding one major incident
Increasing ATM Traffic
Challenge
Improving the customer experience at ATMs is known to increase usage, result in higher customer satisfaction, and improve financial performance for a bank. Analysts want to determine whether installing surrounds around the bank’s ATMs will increase their traffic.
Products
Minitab Statistical Software, Minitab Engage
Solution
Minitab Engage tracks the progress and financial benefits of continuous improvement (CI) projects throughout the organization. Minitab Assistant helps analysts determine the correct tool for analyzing ATM data and provides results in natural language for better understanding of conclusions.
Results
By implementing ATM surrounds, the bank achieved a measurable increase in traffic, customer satisfaction, and financial performance. Industry case studies show that ATM usage can increase by 20–30% with surrounds. For a bank operating 200 ATMs, each averaging 3,000 monthly transactions, this translates to approximately 150,000 additional transactions per month. At the 2025 average out-of-network ATM fee of $4.77 per transaction, this usage lift equates to about $715,500 in incremental fee revenue per month, or $8.6 million annually.
In addition to new fee revenue, the shift of transactions from tellers to ATMs generates significant labor savings. If just 5% of additional ATM transactions (7,500 per month) replace teller visits, and each teller transaction costs banks an average of $4 in labor, the bank saves around $30,000 per month, or $360,000 annually. Together, these outcomes demonstrate that surrounds are not just a customer-experience improvement but also a strong financial investment, with millions in revenue growth and hundreds of thousands in cost savings each year.
- 20%–30% increase: ATM usage uplift with surrounds
- 150K additional transactions per month: from 200 ATMs averaging 3,000 transactions each
- $715K per month / $8.6M annually: incremental ATM fee revenue at $4.77 per transaction
- $30K per month / $360K annually: labor savings from teller transaction replacement
귀사와 같은 팀이 Minitab으로 더 큰 성과를 만드는 방법
제조부터 헬스케어, 금융 서비스에 이르기까지 업계를 선도하는 기업들이 Minitab 솔루션으로 어떻게 측정 가능한 성과를 만들어내는지 확인해 보세요.
산업과 역할을 넘어서, Minitab은 기획과 모니터링부터 리스크를 발견하고 해결하는 것까지 팀이 가장 어려운 과제를 해결하도록 지원합니다.
실제 활용 사례를 통해 선도적인 조직들이 이미 달성한 검증된 성과와 당신의 팀이 그 다음 주자가 될 수 있는 방법을 확인하세요.
-
자동차계절별 온도 영향 분석당면 과제
한 화학 제조사는 배치 간 품질 변동성 문제를 겪고 있었으며, 이러한 불일치의 원인을 규명하고자 했습니다.
특히 해당 지역의 계절별 온도 변화가 생산 공정에 영향을 미칠 수 있다는 가설을 검증하는 것이 목표였습니다.
이를 위해 고온·저온 환경에서 가동되는 설비의 초기 온도 차이가 공정에 영향을 미치는 주요 요인인지를 확인하고자 했습니다.
즉, 더운 계절과 추운 계절에 따라 가열 장비의 조건이 달라지면서 생산 결과에 영향을 줄 수 있는지를 명확히 판단하고자 했습니다.
솔루션Minitab SPC 솔루션(Real‑Time SPC 또는 Prolink)을 활용하여, EWMA 관리도로 원시 데이터를 평활화함으로써 계절적 온도가 생산 결과에 영향을 미치는 시점을 신속하게 식별할 수 있었습니다.
이 관리도는 설비의 초기 온도가 생산 일관성에 유의미한 요인임을 검증하는 데 도움을 주었으며, 현장 담당자들이 적시에 공정 조건을 조정할 수 있도록 지원했습니다.
성과이러한 발견을 통해 제조사는 생산 공정 설계는 물론 제조 및 출하 일정 계획 시 온도 변동 요소를 고려할 수 있게 되었습니다.
EWMA 관리도를 활용해 데이터를 실시간으로 추적함으로써, 주변 온도가 공정에 영향을 미칠 때 신속하게 조치를 취할 수 있었습니다.
배치 간 일관성이 부족할 경우 스크랩 발생, 재작업 증가, 규제 미준수로 이어질 수 있습니다.
연구에 따르면, 변동성으로 인한 중간 규모 화학 공장의 배치 제조 손실은 연간 50만~100만 달러에 이를 수 있습니다.
실시간 통계적 공정 관리(SPC)는 공정의 변화를 조기에 감지하여 낭비를 줄이고 대응 속도를 향상시키는 데 효과적입니다.
예를 들어, 연간 40만 개의 부품을 생산하고 스크랩률이 4%인 제조사의 경우 연간 16만 달러의 손실이 발생합니다.
배치 변동성을 25~50%만 줄여도, 자재 비용과 공정 개선 수준에 따라 연간 4만~8만 달러의 비용 절감 효과를 기대할 수 있습니다.
$50만~$100만 손실연간: 중형 화학 공장에서 변동성으로 인한 배치 제조 손실
$16만 손실연간: 40만 개 생산 기준, 폐기/스크랩률 4%로 인한 손실
$4만~$8만 절감연간: SPC 도입으로 배치 변동성을 25~50% 줄여 달성한 비용 절감
-
의료기기 및 장비인공수정체 삽입 시스템의 정밀도 향상당면 과제
백내장 수술에서는 과거에 집게(forceps)를 사용해 렌즈를 삽입하던 방식 대신, 현재는 인공수정체 삽입 시스템을 사용하는 경우가 점점 늘고 있습니다.
해당 업체는 인공수정체가 미리 장착된 주사기 형태의 인젝터를 설계하여, 외과 의사가 자동화된 삽입 메커니즘을 통해 렌즈를 삽입할 수 있도록 했습니다.
이 과정에서 주사기에 가해지는 힘을 정밀하게 제어하는 것이 매우 중요하며, 과도한 힘이 가해질 경우 인공수정체나 주변 안구 조직이 손상될 수 있습니다.
솔루션해당 조직은 새로운 인젝터를 개발하는 과정에서 DMAIC 공정을 적용했습니다.
구형 설계와 신형 설계 간 주입기/인젝터 압력의 통계적 차이를 평가하기 위해 t‑검정을 포함한 여러 통계적 분석 도구를 활용했습니다.
또한 두 비율 검정(two-proportion test)을 통해 신형 설계에서 불량률이 감소했음이 통계적으로 입증되었습니다.
결과해당 업체는 새로운 장비의 성능을 보다 명확하게 이해하게 되었으며, 이를 통해 장비가 요구되는 핵심 파라미터를 충족함을 확인할 수 있었습니다.
이처럼 공정과 데이터에 대한 신뢰는 지속적으로 더 새롭고 개선된 제품을 개발하는 데 기반이 되고 있습니다.
이러한 정성적 성과에 더해, 사전 장착형 인공수정체(IOL) 인젝터 시스템에 대한 연구에서는 명확하고 측정 가능한 결과도 확인되었습니다.
수술당 30초에서 1분 이상 시간이 절감되어, 연간 기준으로 5~8%의 수술 처리량 증가로 이어졌으며, 이는 연간 최대 1,440건의 추가 수술 수행에 해당합니다.
이러한 효율성 향상은 시설당 연간 28만 4천 달러에서 56만 5천 달러의 추가 매출을 창출하는 동시에, 불필요한 인공수정체 접촉을 제거하고 준비 지연을 최소화함으로써 오염 위험 감소에도 기여합니다.
사례당 30초~1분 절감사전 장착형 인공수정체(IOL) 인젝터 시스템을 통한 수술 시간 단축
연간 처리량 5~8% 증가최대 연간 1,440건의 추가 수술 수행 가능
연간 $28만4천~$56만5천 창출효율성 향상을 통해 시설당 추가로 창출된 매출
오염 위험 감소인공수정체(IOL) 불필요한 접촉과 준비 지연을 줄여 환자 안전과 운영 효율 향상
-
제약업자동화된 약물 안정성 검사당면 과제
안정성 시험은 온도, 습도, 빛과 같은 다양한 환경 조건에서 의약품이나 제품이 시간이 지나도 유효성, 순도, 품질을 얼마나 잘 유지하는지를 평가합니다.
제약 연구원들은 이러한 시험을 통해 유효기간을 결정하고, 보관·취급·표시(Labeling) 지침을 수립합니다.
안정성 시험은 여러 배치와 다양한 시점에 걸쳐 수많은 변수를 포함하기 때문에 체계적이고 정밀한 분석이 필수적입니다.
솔루션Minitab Connect는 최신 데이터를 자동으로 읽어들여 분석에 적합하도록 가공하고, Minitab 통계 소프트웨어를 활용해 안정성 시험을 수행한 뒤 그 결과를 Connect 대시보드로 다시 보고하도록 구성되었습니다.
이를 통해 분석 결과를 한곳에서 시각적으로 확인하고, 미국 식품의약국(US FDA)과도 손쉽게 공유할 수 있었습니다.
성과각 FDA 안정성 보고서 생성 시간은 기존의 수 시간 소요 방식에서 완전 자동화로 전환되어, 새로운 데이터가 생성되는 즉시 보고서를 업데이트할 수 있게 되었습니다.
업계 전반에서 이러한 자동화는 일반적으로
- 수작업 데이터 입력 오류를 40~90% 감소시키고
- 생산성을 40% 이상 향상시켜
분석가들이 반복적인 보고 작업이 아닌 더 높은 부가가치의 분석 업무에 집중할 수 있도록 합니다.
또한 안정성 소프트웨어는
- 강력한 규제 준수 체계 확보,
- 감사 추적(audit trail)을 통한 데이터 무결성 유지,
- 제출 준비가 완료된 일관된 형식의 보고서 제공을 통해
규제 미준수나 데이터 무결성 문제로 인한 리스크를 최소화합니다.
자동화로 시간 단축FDA 안정성 보고서 생성이 실시간 수준으로 단축
40~90% 감소자동화로 반복 입력을 제거해 오류를 줄이고 데이터 신뢰성을 향상
40%+ 향상생산성 향상으로 분석가의 시간 확보, 고부가가치 업무에 집중 가능
규제 리스크 감소제출 준비가 완료된 보고서와 감사 추적을 통해 고비용 오류를 최소화
-
F&B 식음료병입 공정 품질 개선당면 과제
한 병입 공장의 품질 엔지니어는 사후 대응 위주의 문제 해결 방식으로 인해 제품 품질의 일관성 저하에 어려움을 겪고 있었습니다.
충진량이 너무 적거나 과다한 문제, 라벨 부착 불량,탄산 농도의 불균일 등과 같은 이슈가 대량의 스크랩과 재작업이 발생한 이후에야 발견되는 경우가 많아시간과 비용의 손실로 이어졌습니다.
또한 구식 보고서와 수작업 데이터 취합으로 인해 문제의 근본 원인을 적시에 파악하는 데 한계가 있었습니다.
솔루션Minitab Real‑Time SPC와 Prolink는 생산 데이터에 대한 즉각적인 가시성을 제공하여 품질 엔지니어가 충진량, 탄산, 캡핑 공정의 편차를 실시간으로 감지할 수 있도록 합니다.
관리도는 공정의 변화와 추세를 자동으로 알림으로 제공하여 불량이 누적되기 전에 사전 대응이 가능하도록 합니다.
또한 Minitab 통계 소프트웨어와의 통합을 통해 품질 엔지니어는 Real‑Time SPC 대시보드에서 바로 고급 분석을 수행할 수 있습니다.
결과Minitab SPC 솔루션을 도입한 결과, 해당 병입 공장은 공정 편차를 조기에 감지하고 즉각적으로 수정할 수 있게 되면서 페기/스크랩과 재작업을 획기적으로 감소시켰습니다.
그 결과
- 충진량 일관성 향상
- 비가동 시간 감소
- 고객 불만 건수 감소로 이어졌으며,
이는 곧 측정 가능한 비용 절감과 고객 만족도 향상으로 연결되었습니다.
업계 연구에 따르면, 음료 제조 공장은 일반적으로전체 생산량의 1~3%를 페기/스크랩 및 재작업으로 손실하고 있으며, 연간 약 2억 병을 생산하는 중간 규모 병입 공장의 경우 연간 50만~150만 달러의 비용 손실이 발생할 수 있습니다.
실시간 SPC 솔루션은 기/스크랩과 재작업을 50~90%까지 감소시키고, 외부로 유출되는 불량률을 8%에서 0.5% 수준으로 낮추는 것으로 나타났습니다.
연간 폐기/스크랩 비용이 100만 달러에 달하는 공장이라면, 이를 통해 연간 50만~90만 달러의 비용 절감 효과를 기대할 수 있습니다.
여기에 더해, 비가동 시간 감소와 고객 불만 축소는 보증 비용 절감과 브랜드 신뢰도 보호로 이어져, 전반적인 재무 성과를 더욱 강화합니다.
$50만~$150만 손실연간: 중형 규모 병입 공장에서 스크랩과 재작업으로 발생하는 일반적인 비용 손실 규모
50~90% 감소실시간 SPC 도입으로 폐기/스크랩·재작업 실현 가능한 비용 절감 효과
$50만~$90만 절감연간: 스크랩 비용이 100만 달러인 공장에서 기대 가능한 연간 비용 절감 효과
유출 불량률 8% → 0.5% 감소실시간 모니터링으로 공정 이탈 불량을 획기적으로 감소
-
병원응급실(ED) 대기·체류 시간 단축 및 개선당면 과제
응급실(ED) 체류 시간 단축은 병목 구간을 파악하고 대기 시간을 줄이며, 자원 배분을 최적화하고 환자 경험을 개선하며, 전반적인 운영 효율을 높이기 위해 필수적입니다.
응급실 프로세스를 효과적으로 관리하는 것은 환자에게 적시에 치료를 제공하고 의료 자원을 최적으로 활용하는 데 핵심적인 역할을 합니다.
솔루션해당 의료기관은 Minitab Workspace의 프로세스 맵과 가치 흐름 맵(Value Stream Map)을 활용해 업무 프로세스를 최적화하고, 비효율을 줄이며, 잠재적 리스크를 완화했습니다.
워크플로우를 시각적으로 매핑함으로써 병목 구간과 개선 기회를 명확히 파악할 수 있었습니다.
이후 Minitab Simul8을 활용해 향후 병상 가용성을 시뮬레이션함으로써 응급실(ED) 적체를 완화하고 자원 배분을 최적화하여 전반적인 운영 성과를 향상시켰습니다.
성과의료 환경 전반에서 지속적인 비용 절감과 각종 제약으로 인해 가용 자원은 점점 더 제한적이고 중요해지고 있습니다.
Simul8과 같은 도구는 자원을 합리적으로 배분하면서도 최고 수준의 성과를 달성할 수 있도록 지원합니다. 이러한 개선은 응급실(ED) 환자 경험을 향상시키고, 전반적인 운영 효율을 높이는 데 기여합니다.
Johns Hopkins는 Howard County Hospital에서 응급실 시뮬레이션 모델을 구축했으며, 이를 시스템 전반에 적용해 ‘대기 없는 응급(Zero‑Wait ED)’을 목표로 한 혁신을 추진했습니다.
이 시뮬레이션을 통해
- 평균 재원 시간(LOS)이 16% 감소하고,
- 대기 시간이 61.8분에서 16.2분으로 대폭 단축되는 성과를 달성했습니다.
그 결과 환자 흐름이 더욱 빨라지고, 대기 시간이 감소하며, 자원 배분이 최적화되어 해당 의료기관은 무대기 응급실 목표에 크게 가까워졌습니다.
또한 시뮬레이션 분석 결과는 전략적 인프라 의사결정에도 활용되어, Bayview Medical Center의 4,000만 달러 규모의 응급실 확장을 위한 수용능력 계획 수립에 중요한 근거를 제공했습니다.
재원 시간(LOS) 16% 감소응급실(ED)에서 환자 평균 체류 시간을 유의미하게 단축
평균 대기 시간 61.8분 → 16.2분 단축응급실(ED) 평균 대기 시간을 획기적으로 단축
$4,000만 규모 확장 투자시뮬레이션 인사이트가 Bayview Medical Center의 수용 능력 계획을 지원
-
검사실검사 결과 대기 시간 단축 및 개선당면 과제
검사 결과 대기 시간 단축은 정확한 진단과 효과적인 치료를 위해 필수적입니다.
의료진은 신뢰할 수 있는 대기 시간 예측이 필요하지만, 검사 결과 대기 시간의 변동성이 지나치게 크고 결과를 받는 데 시간이 오래 걸리는 경우가 많습니다.
이러한 지연은
- 환자의 불안감을 장기화시키고
- 치료 결정이 늦어지며
- 전반적인 의료 서비스 제공 효율을 저하시키는 원인이 됩니다.
솔루션해당 진단 검사실은 먼저 대기 시간 KPI 대비 현재 성과를 평가하기 위해 기준 데이터(baseline data)를 수집했습니다.
Minitab을 활용해 환자 데이터를 종합적으로 분석함으로써 대기 시간과 관련된 추세와 패턴을 식별하고, 보다 근거 있는 의사결정을 내릴 수 있었습니다.
또한 Minitab Assistant는 사용자가 상황에 가장 적합한 통계 분석 방법을 선택할 수 있도록 안내하며, 분석 결과를 자연어로 해석해 제공하고 가정 조건을 자동으로 검증함으로써 분석의 신뢰성과 효율성을 높였습니다.
성과이 과제를 해결하기 위해 검사실은 Minitab Simul8을 활용해 진단 장비 2대를 추가로 도입했을 경우의 영향을 시뮬레이션했습니다.
시뮬레이션 결과, 현재 보유 중인 장비는 최대 용량까지 활용되지 않고 있었으며, 병목의 원인은 장비 부족이 아니라 검사 장비에 충분한 ‘버퍼 재고(buffer stock)’가 유지되지 않은 점에 있음을 확인했습니다.
병목의 진짜 원인을 정확히 파악함으로써, 병원은 불필요한 추가 장비 구매를 피할 수 있었고 그 결과 약 4만 5천 달러의 비용을 절감했습니다.
단순하지만 명확한 데이터 분석을 통해, 문제의 핵심은 장비 수가 아니라 기존 자원의 비효율적인 활용에 있음을 밝혀낸 것입니다.
이러한 인사이트를 기반으로 개선 조치를 실행한 결과, 검사 결과 대기 시간이 크게 단축되었으며, 환자 진료 품질 향상, 운영 효율 개선, 그리고 실질적인 비용 절감이라는 세 가지 성과를 동시에 달성할 수 있었습니다.
$4만 5천 비용 절감불필요한 검사 장비 추가 구매를 피함으로써 달성한 절감 효과
대기 시간 단축기존 자원을 효율적으로 활용해 검사 결과 제공 속도를 개선
운영 효율 향상신규 설비 투자 없이 장비와 자원을 더욱 효과적으로 활용
-
석유 및 가스석유 및 가스 산업의 예지 정비당면 과제
한 석유 및 가스 기업은 부식 속도, 진동 수준, 압력과 같은 변수에서 유지보수 이벤트에 앞서 나타나는 패턴을 식별하고자 했습니다.
이를 통해 문제가 발생하기 전에 조기 대응이 가능해져, 예기치 않은 비가동 시간을 줄이고 고비용의 설비 고장을 예방할 수 있습니다.
솔루션예측 분석(Predictive Analytics) 모듈의 자동화 머신러닝을 통해 분석가는 현장에서 예기치 않은 유지보수 이슈로 이어질 가능성이 높은 조건을 식별할 수 있습니다.
또한 Minitab Connect를 활용하면 중요한 변수를 실시간으로 모니터링할 수 있으며, 공정이 관리 한계를 벗어날 경우 자동으로 알림이 전송되어 조기 대응과 선제적인 유지보수가 가능해집니다.
성과석유 및 가스 산업에서 예지 정비 분석은 연간 수백만 달러 규모의 비용 절감, 자산 신뢰성 향상, 그리고 더 안전하고 지속 가능한 운영으로 이어질 수 있습니다.
예기치 않은 비가동으로 인한 비용은 다음과 같습니다.
- 해양 시추 설비(Offshore rig): 시간당 10만~30만 달러
- 육상 정제 설비(Onshore refinery): 시간당 2만~5만 달러
예측 모델을 통해 단 한 번의 주요 설비 고장만 예방해도, 수 시간 또는 수일에 달하는 비가동을 피함으로써 연간 수백만 달러의 손실을 방지할 수 있습니다.
또한 예측 분석은
- 유지보수 비용을 20~30% 절감할 수 있으며, 이는 대형 정유 공장의 경우 연간 100만~300만 달러 수준의 절감 효과에 해당합니다.
핵심 설비(예: 압축기, 펌프)의 수명을 단 1~2년만 연장해도, 자산당 50만~200만 달러의 비용 절감이 가능합니다.
더 나아가, 한 건의 중대한 사고를 예방하는 것만으로도 벌금, 정화 비용, 평판 손실 등을 포함해 1,000만 달러 이상의 잠재적 손실을 방지할 수 있습니다.
시간당 $10만~$30만 손실해양 시추 설비(Offshore rig)에서 발생하는 예기치 않은 비가동 비용시간당 $2만~$5만 손실육상 정제 설비(Onshore refinery)에서 발생하는 예기치 않은 비가동 비용
연간 $100만~$300만 절감유지보수 비용을 20~30% 줄여 대형 정유 공장에서 달성 가능한 연간 비용 절감 효과
자산당 $50만~$200만 절감핵심 설비의 수명을 1~2년 연장해 달성 가능한 비용 절감 효과
$1,000만+ 손실 예방중대한 사고를 사전에 방지해 벌금, 정화 비용, 평판 손상을 예방
-
금융ATM 이용률 증가당면 과제
ATM에서의 고객 경험 개선은 이용률 증가, 고객 만족도 향상, 그리고 은행의 재무 성과 개선으로 이어지는 것으로 알려져 있습니다.
이에 따라 분석가들은 은행의 ATM 주변에 가림막을 설치할 경우 ATM 이용률이 실제로 증가하는지를 검증하고자 했습니다.
솔루션Minitab Engage는 조직 전반에 걸친 지속적 개선(CI) 프로젝트의 진행 상황과 재무적 효과를 체계적으로 추적합니다.
또한 Minitab Assistant는 분석가가 ATM 데이터 분석에 가장 적합한 통계 도구를 선택할 수 있도록 지원하며, 분석 결과를 자연어로 해석해 제공함으로써 결론에 대한 이해도를 높여줍니다.
성과ATM 가림막을 도입한 결과, 해당 은행은 이용률, 고객 만족도, 그리고 재무 성과 전반에서 측정 가능한 성과를 확인했습니다.
업계 사례에 따르면, ATM 가림막 설치 시 ATM 이용률은 20~30%까지 증가할 수 있습니다. 월평균 3,000건의 거래를 처리하는 200대의 ATM을 운영하는 은행의 경우, 이는 월 약 15만 건의 추가 거래에 해당합니다.
2025년 기준 평균 거래 수수료 건당 4.77달러를 적용하면, 이는 월 약 71만 5천 달러, 연간 약 860만 달러의 추가 수수료 수익으로 이어집니다.
또한 이 중 단 5%의 거래만 창구 직원에서 ATM으로 전환해도, 월 3만 달러, 연간 약 36만 달러의 인건비 절감 효과를 기대할 수 있습니다.
이용률 20~30% 증가ATM 가림막 설치를 통해 달성한 이용률 상승 효과월 15만 건 추가 거래ATM 200대 운영 기준, 대당 월 평균 3,000건 거래에서 발생한 증가 효과
월 $71만 5천 / 연간 $860만 추가 매출거래당 평균 수수료 4.77달러 기준으로 발생한 ATM 수수료 수익 증가 효과
월 $3만 / 연간 $36만 인건비 절감창구 거래를 ATM 거래로 전환해 실현한 인력 비용 절감 효과
계절별 온도 영향 분석
당면 과제
한 화학 제조사는 배치 간 품질 변동성 문제를 겪고 있었으며, 이러한 불일치의 원인을 규명하고자 했습니다.
특히 해당 지역의 계절별 온도 변화가 생산 공정에 영향을 미칠 수 있다는 가설을 검증하는 것이 목표였습니다.
이를 위해 고온·저온 환경에서 가동되는 설비의 초기 온도 차이가 공정에 영향을 미치는 주요 요인인지를 확인하고자 했습니다.
즉, 더운 계절과 추운 계절에 따라 가열 장비의 조건이 달라지면서 생산 결과에 영향을 줄 수 있는지를 명확히 판단하고자 했습니다.
솔루션
Minitab SPC 솔루션(Real‑Time SPC 또는 Prolink)을 활용하여, EWMA 관리도로 원시 데이터를 평활화함으로써 계절적 온도가 생산 결과에 영향을 미치는 시점을 신속하게 식별할 수 있었습니다.
이 관리도는 설비의 초기 온도가 생산 일관성에 유의미한 요인임을 검증하는 데 도움을 주었으며, 현장 담당자들이 적시에 공정 조건을 조정할 수 있도록 지원했습니다.
성과
이러한 발견을 통해 제조사는 생산 공정 설계는 물론 제조 및 출하 일정 계획 시 온도 변동 요소를 고려할 수 있게 되었습니다.
EWMA 관리도를 활용해 데이터를 실시간으로 추적함으로써, 주변 온도가 공정에 영향을 미칠 때 신속하게 조치를 취할 수 있었습니다.
배치 간 일관성이 부족할 경우 스크랩 발생, 재작업 증가, 규제 미준수로 이어질 수 있습니다.
연구에 따르면, 변동성으로 인한 중간 규모 화학 공장의 배치 제조 손실은 연간 50만~100만 달러에 이를 수 있습니다.
실시간 통계적 공정 관리(SPC)는 공정의 변화를 조기에 감지하여 낭비를 줄이고 대응 속도를 향상시키는 데 효과적입니다.
예를 들어, 연간 40만 개의 부품을 생산하고 스크랩률이 4%인 제조사의 경우 연간 16만 달러의 손실이 발생합니다.
배치 변동성을 25~50%만 줄여도, 자재 비용과 공정 개선 수준에 따라 연간 4만~8만 달러의 비용 절감 효과를 기대할 수 있습니다.
연간: 중형 화학 공장에서 변동성으로 인한 배치 제조 손실
연간: 40만 개 생산 기준, 폐기/스크랩률 4%로 인한 손실
연간: SPC 도입으로 배치 변동성을 25~50% 줄여 달성한 비용 절감
인공수정체 삽입 시스템의 정밀도 향상
당면 과제
백내장 수술에서는 과거에 집게(forceps)를 사용해 렌즈를 삽입하던 방식 대신, 현재는 인공수정체 삽입 시스템을 사용하는 경우가 점점 늘고 있습니다.
해당 업체는 인공수정체가 미리 장착된 주사기 형태의 인젝터를 설계하여, 외과 의사가 자동화된 삽입 메커니즘을 통해 렌즈를 삽입할 수 있도록 했습니다.
이 과정에서 주사기에 가해지는 힘을 정밀하게 제어하는 것이 매우 중요하며, 과도한 힘이 가해질 경우 인공수정체나 주변 안구 조직이 손상될 수 있습니다.
솔루션
해당 조직은 새로운 인젝터를 개발하는 과정에서 DMAIC 공정을 적용했습니다.
구형 설계와 신형 설계 간 주입기/인젝터 압력의 통계적 차이를 평가하기 위해 t‑검정을 포함한 여러 통계적 분석 도구를 활용했습니다.
또한 두 비율 검정(two-proportion test)을 통해 신형 설계에서 불량률이 감소했음이 통계적으로 입증되었습니다.
결과
해당 업체는 새로운 장비의 성능을 보다 명확하게 이해하게 되었으며, 이를 통해 장비가 요구되는 핵심 파라미터를 충족함을 확인할 수 있었습니다.
이처럼 공정과 데이터에 대한 신뢰는 지속적으로 더 새롭고 개선된 제품을 개발하는 데 기반이 되고 있습니다.
이러한 정성적 성과에 더해, 사전 장착형 인공수정체(IOL) 인젝터 시스템에 대한 연구에서는 명확하고 측정 가능한 결과도 확인되었습니다.
수술당 30초에서 1분 이상 시간이 절감되어, 연간 기준으로 5~8%의 수술 처리량 증가로 이어졌으며, 이는 연간 최대 1,440건의 추가 수술 수행에 해당합니다.
이러한 효율성 향상은 시설당 연간 28만 4천 달러에서 56만 5천 달러의 추가 매출을 창출하는 동시에, 불필요한 인공수정체 접촉을 제거하고 준비 지연을 최소화함으로써 오염 위험 감소에도 기여합니다.
사전 장착형 인공수정체(IOL) 인젝터 시스템을 통한 수술 시간 단축
최대 연간 1,440건의 추가 수술 수행 가능
효율성 향상을 통해 시설당 추가로 창출된 매출
인공수정체(IOL) 불필요한 접촉과 준비 지연을 줄여 환자 안전과 운영 효율 향상
자동화된 약물 안정성 검사
당면 과제
안정성 시험은 온도, 습도, 빛과 같은 다양한 환경 조건에서 의약품이나 제품이 시간이 지나도 유효성, 순도, 품질을 얼마나 잘 유지하는지를 평가합니다.
제약 연구원들은 이러한 시험을 통해 유효기간을 결정하고, 보관·취급·표시(Labeling) 지침을 수립합니다.
안정성 시험은 여러 배치와 다양한 시점에 걸쳐 수많은 변수를 포함하기 때문에 체계적이고 정밀한 분석이 필수적입니다.
솔루션
Minitab Connect는 최신 데이터를 자동으로 읽어들여 분석에 적합하도록 가공하고, Minitab 통계 소프트웨어를 활용해 안정성 시험을 수행한 뒤 그 결과를 Connect 대시보드로 다시 보고하도록 구성되었습니다.
이를 통해 분석 결과를 한곳에서 시각적으로 확인하고, 미국 식품의약국(US FDA)과도 손쉽게 공유할 수 있었습니다.
성과
각 FDA 안정성 보고서 생성 시간은 기존의 수 시간 소요 방식에서 완전 자동화로 전환되어, 새로운 데이터가 생성되는 즉시 보고서를 업데이트할 수 있게 되었습니다.
업계 전반에서 이러한 자동화는 일반적으로
- 수작업 데이터 입력 오류를 40~90% 감소시키고
- 생산성을 40% 이상 향상시켜
분석가들이 반복적인 보고 작업이 아닌 더 높은 부가가치의 분석 업무에 집중할 수 있도록 합니다.
또한 안정성 소프트웨어는
- 강력한 규제 준수 체계 확보,
- 감사 추적(audit trail)을 통한 데이터 무결성 유지,
- 제출 준비가 완료된 일관된 형식의 보고서 제공을 통해
규제 미준수나 데이터 무결성 문제로 인한 리스크를 최소화합니다.
FDA 안정성 보고서 생성이 실시간 수준으로 단축
자동화로 반복 입력을 제거해 오류를 줄이고 데이터 신뢰성을 향상
생산성 향상으로 분석가의 시간 확보, 고부가가치 업무에 집중 가능
제출 준비가 완료된 보고서와 감사 추적을 통해 고비용 오류를 최소화
병입 공정 품질 개선
당면 과제
한 병입 공장의 품질 엔지니어는 사후 대응 위주의 문제 해결 방식으로 인해 제품 품질의 일관성 저하에 어려움을 겪고 있었습니다.
충진량이 너무 적거나 과다한 문제, 라벨 부착 불량,탄산 농도의 불균일 등과 같은 이슈가 대량의 스크랩과 재작업이 발생한 이후에야 발견되는 경우가 많아시간과 비용의 손실로 이어졌습니다.
또한 구식 보고서와 수작업 데이터 취합으로 인해 문제의 근본 원인을 적시에 파악하는 데 한계가 있었습니다.
솔루션
Minitab Real‑Time SPC와 Prolink는 생산 데이터에 대한 즉각적인 가시성을 제공하여 품질 엔지니어가 충진량, 탄산, 캡핑 공정의 편차를 실시간으로 감지할 수 있도록 합니다.
관리도는 공정의 변화와 추세를 자동으로 알림으로 제공하여 불량이 누적되기 전에 사전 대응이 가능하도록 합니다.
또한 Minitab 통계 소프트웨어와의 통합을 통해 품질 엔지니어는 Real‑Time SPC 대시보드에서 바로 고급 분석을 수행할 수 있습니다.
결과
Minitab SPC 솔루션을 도입한 결과, 해당 병입 공장은 공정 편차를 조기에 감지하고 즉각적으로 수정할 수 있게 되면서 페기/스크랩과 재작업을 획기적으로 감소시켰습니다.
그 결과
- 충진량 일관성 향상
- 비가동 시간 감소
- 고객 불만 건수 감소로 이어졌으며,
이는 곧 측정 가능한 비용 절감과 고객 만족도 향상으로 연결되었습니다.
업계 연구에 따르면, 음료 제조 공장은 일반적으로전체 생산량의 1~3%를 페기/스크랩 및 재작업으로 손실하고 있으며, 연간 약 2억 병을 생산하는 중간 규모 병입 공장의 경우 연간 50만~150만 달러의 비용 손실이 발생할 수 있습니다.
실시간 SPC 솔루션은 기/스크랩과 재작업을 50~90%까지 감소시키고, 외부로 유출되는 불량률을 8%에서 0.5% 수준으로 낮추는 것으로 나타났습니다.
연간 폐기/스크랩 비용이 100만 달러에 달하는 공장이라면, 이를 통해 연간 50만~90만 달러의 비용 절감 효과를 기대할 수 있습니다.
여기에 더해, 비가동 시간 감소와 고객 불만 축소는 보증 비용 절감과 브랜드 신뢰도 보호로 이어져, 전반적인 재무 성과를 더욱 강화합니다.
연간: 중형 규모 병입 공장에서 스크랩과 재작업으로 발생하는 일반적인 비용 손실 규모
실시간 SPC 도입으로 폐기/스크랩·재작업 실현 가능한 비용 절감 효과
연간: 스크랩 비용이 100만 달러인 공장에서 기대 가능한 연간 비용 절감 효과
실시간 모니터링으로 공정 이탈 불량을 획기적으로 감소
응급실(ED) 대기·체류 시간 단축 및 개선
당면 과제
응급실(ED) 체류 시간 단축은 병목 구간을 파악하고 대기 시간을 줄이며, 자원 배분을 최적화하고 환자 경험을 개선하며, 전반적인 운영 효율을 높이기 위해 필수적입니다.
응급실 프로세스를 효과적으로 관리하는 것은 환자에게 적시에 치료를 제공하고 의료 자원을 최적으로 활용하는 데 핵심적인 역할을 합니다.
솔루션
해당 의료기관은 Minitab Workspace의 프로세스 맵과 가치 흐름 맵(Value Stream Map)을 활용해 업무 프로세스를 최적화하고, 비효율을 줄이며, 잠재적 리스크를 완화했습니다.
워크플로우를 시각적으로 매핑함으로써 병목 구간과 개선 기회를 명확히 파악할 수 있었습니다.
이후 Minitab Simul8을 활용해 향후 병상 가용성을 시뮬레이션함으로써 응급실(ED) 적체를 완화하고 자원 배분을 최적화하여 전반적인 운영 성과를 향상시켰습니다.
성과
의료 환경 전반에서 지속적인 비용 절감과 각종 제약으로 인해 가용 자원은 점점 더 제한적이고 중요해지고 있습니다.
Simul8과 같은 도구는 자원을 합리적으로 배분하면서도 최고 수준의 성과를 달성할 수 있도록 지원합니다. 이러한 개선은 응급실(ED) 환자 경험을 향상시키고, 전반적인 운영 효율을 높이는 데 기여합니다.
Johns Hopkins는 Howard County Hospital에서 응급실 시뮬레이션 모델을 구축했으며, 이를 시스템 전반에 적용해 ‘대기 없는 응급(Zero‑Wait ED)’을 목표로 한 혁신을 추진했습니다.
이 시뮬레이션을 통해
- 평균 재원 시간(LOS)이 16% 감소하고,
- 대기 시간이 61.8분에서 16.2분으로 대폭 단축되는 성과를 달성했습니다.
그 결과 환자 흐름이 더욱 빨라지고, 대기 시간이 감소하며, 자원 배분이 최적화되어 해당 의료기관은 무대기 응급실 목표에 크게 가까워졌습니다.
또한 시뮬레이션 분석 결과는 전략적 인프라 의사결정에도 활용되어, Bayview Medical Center의 4,000만 달러 규모의 응급실 확장을 위한 수용능력 계획 수립에 중요한 근거를 제공했습니다.
응급실(ED)에서 환자 평균 체류 시간을 유의미하게 단축
응급실(ED) 평균 대기 시간을 획기적으로 단축
시뮬레이션 인사이트가 Bayview Medical Center의 수용 능력 계획을 지원
검사 결과 대기 시간 단축 및 개선
당면 과제
검사 결과 대기 시간 단축은 정확한 진단과 효과적인 치료를 위해 필수적입니다.
의료진은 신뢰할 수 있는 대기 시간 예측이 필요하지만, 검사 결과 대기 시간의 변동성이 지나치게 크고 결과를 받는 데 시간이 오래 걸리는 경우가 많습니다.
이러한 지연은
- 환자의 불안감을 장기화시키고
- 치료 결정이 늦어지며
- 전반적인 의료 서비스 제공 효율을 저하시키는 원인이 됩니다.
솔루션
해당 진단 검사실은 먼저 대기 시간 KPI 대비 현재 성과를 평가하기 위해 기준 데이터(baseline data)를 수집했습니다.
Minitab을 활용해 환자 데이터를 종합적으로 분석함으로써 대기 시간과 관련된 추세와 패턴을 식별하고, 보다 근거 있는 의사결정을 내릴 수 있었습니다.
또한 Minitab Assistant는 사용자가 상황에 가장 적합한 통계 분석 방법을 선택할 수 있도록 안내하며, 분석 결과를 자연어로 해석해 제공하고 가정 조건을 자동으로 검증함으로써 분석의 신뢰성과 효율성을 높였습니다.
성과
이 과제를 해결하기 위해 검사실은 Minitab Simul8을 활용해 진단 장비 2대를 추가로 도입했을 경우의 영향을 시뮬레이션했습니다.
시뮬레이션 결과, 현재 보유 중인 장비는 최대 용량까지 활용되지 않고 있었으며, 병목의 원인은 장비 부족이 아니라 검사 장비에 충분한 ‘버퍼 재고(buffer stock)’가 유지되지 않은 점에 있음을 확인했습니다.
병목의 진짜 원인을 정확히 파악함으로써, 병원은 불필요한 추가 장비 구매를 피할 수 있었고 그 결과 약 4만 5천 달러의 비용을 절감했습니다.
단순하지만 명확한 데이터 분석을 통해, 문제의 핵심은 장비 수가 아니라 기존 자원의 비효율적인 활용에 있음을 밝혀낸 것입니다.
이러한 인사이트를 기반으로 개선 조치를 실행한 결과, 검사 결과 대기 시간이 크게 단축되었으며, 환자 진료 품질 향상, 운영 효율 개선, 그리고 실질적인 비용 절감이라는 세 가지 성과를 동시에 달성할 수 있었습니다.
불필요한 검사 장비 추가 구매를 피함으로써 달성한 절감 효과
기존 자원을 효율적으로 활용해 검사 결과 제공 속도를 개선
신규 설비 투자 없이 장비와 자원을 더욱 효과적으로 활용
석유 및 가스 산업의 예지 정비
당면 과제
한 석유 및 가스 기업은 부식 속도, 진동 수준, 압력과 같은 변수에서 유지보수 이벤트에 앞서 나타나는 패턴을 식별하고자 했습니다.
이를 통해 문제가 발생하기 전에 조기 대응이 가능해져, 예기치 않은 비가동 시간을 줄이고 고비용의 설비 고장을 예방할 수 있습니다.
솔루션
예측 분석(Predictive Analytics) 모듈의 자동화 머신러닝을 통해 분석가는 현장에서 예기치 않은 유지보수 이슈로 이어질 가능성이 높은 조건을 식별할 수 있습니다.
또한 Minitab Connect를 활용하면 중요한 변수를 실시간으로 모니터링할 수 있으며, 공정이 관리 한계를 벗어날 경우 자동으로 알림이 전송되어 조기 대응과 선제적인 유지보수가 가능해집니다.
성과
석유 및 가스 산업에서 예지 정비 분석은 연간 수백만 달러 규모의 비용 절감, 자산 신뢰성 향상, 그리고 더 안전하고 지속 가능한 운영으로 이어질 수 있습니다.
예기치 않은 비가동으로 인한 비용은 다음과 같습니다.
- 해양 시추 설비(Offshore rig): 시간당 10만~30만 달러
- 육상 정제 설비(Onshore refinery): 시간당 2만~5만 달러
예측 모델을 통해 단 한 번의 주요 설비 고장만 예방해도, 수 시간 또는 수일에 달하는 비가동을 피함으로써 연간 수백만 달러의 손실을 방지할 수 있습니다.
또한 예측 분석은
- 유지보수 비용을 20~30% 절감할 수 있으며, 이는 대형 정유 공장의 경우 연간 100만~300만 달러 수준의 절감 효과에 해당합니다.
핵심 설비(예: 압축기, 펌프)의 수명을 단 1~2년만 연장해도, 자산당 50만~200만 달러의 비용 절감이 가능합니다.
더 나아가, 한 건의 중대한 사고를 예방하는 것만으로도 벌금, 정화 비용, 평판 손실 등을 포함해 1,000만 달러 이상의 잠재적 손실을 방지할 수 있습니다.
육상 정제 설비(Onshore refinery)에서 발생하는 예기치 않은 비가동 비용
유지보수 비용을 20~30% 줄여 대형 정유 공장에서 달성 가능한 연간 비용 절감 효과
핵심 설비의 수명을 1~2년 연장해 달성 가능한 비용 절감 효과
중대한 사고를 사전에 방지해 벌금, 정화 비용, 평판 손상을 예방
ATM 이용률 증가
당면 과제
ATM에서의 고객 경험 개선은 이용률 증가, 고객 만족도 향상, 그리고 은행의 재무 성과 개선으로 이어지는 것으로 알려져 있습니다.
이에 따라 분석가들은 은행의 ATM 주변에 가림막을 설치할 경우 ATM 이용률이 실제로 증가하는지를 검증하고자 했습니다.
솔루션
Minitab Engage는 조직 전반에 걸친 지속적 개선(CI) 프로젝트의 진행 상황과 재무적 효과를 체계적으로 추적합니다.
또한 Minitab Assistant는 분석가가 ATM 데이터 분석에 가장 적합한 통계 도구를 선택할 수 있도록 지원하며, 분석 결과를 자연어로 해석해 제공함으로써 결론에 대한 이해도를 높여줍니다.
성과
ATM 가림막을 도입한 결과, 해당 은행은 이용률, 고객 만족도, 그리고 재무 성과 전반에서 측정 가능한 성과를 확인했습니다.
업계 사례에 따르면, ATM 가림막 설치 시 ATM 이용률은 20~30%까지 증가할 수 있습니다. 월평균 3,000건의 거래를 처리하는 200대의 ATM을 운영하는 은행의 경우, 이는 월 약 15만 건의 추가 거래에 해당합니다.
2025년 기준 평균 거래 수수료 건당 4.77달러를 적용하면, 이는 월 약 71만 5천 달러, 연간 약 860만 달러의 추가 수수료 수익으로 이어집니다.
또한 이 중 단 5%의 거래만 창구 직원에서 ATM으로 전환해도, 월 3만 달러, 연간 약 36만 달러의 인건비 절감 효과를 기대할 수 있습니다.
ATM 200대 운영 기준, 대당 월 평균 3,000건 거래에서 발생한 증가 효과
거래당 평균 수수료 4.77달러 기준으로 발생한 ATM 수수료 수익 증가 효과
창구 거래를 ATM 거래로 전환해 실현한 인력 비용 절감 효과
Seasonal Temperature Impact Analysis
Challenge
A chemical manufacturer was experiencing variability in results from batch to batch and sought to find reasons for these inconsistent results. They aimed to validate the theory that seasonal temperature changes in their geographic area could affect production. Specifically, they needed to determine if the initial temperature of the machine was a valid factor, as heating something up when it is already hot out versus when it is cold out might affect the process.
Products
Minitab Real-Time SPC and Minitab Prolink
Solution
Using Minitab SPC solutions (Real-Time SPC or Prolink), they smoothed the raw data with an EWMA chart to quickly identify when seasonal temperature affects production results. This chart helped validate the significance of initial machine temperature as a factor in production consistency and allowed personnel to make timely adjustments.
Results
This discovery allowed them to consider temperature fluctuations in developing their production process and planning for manufacturing and shipping timelines. The analysis confirmed that initial temperature is a factor to be considered, aiding in resolving batch variability issues. Following the data in real time using an EWMA chart allowed them to quickly make adjustments when ambient temperature came into play.
Inconsistent batches can result in scrap, rework, or regulatory non-compliance. Studies show that batch manufacturing losses due to variability can reach $500,000–$1 million annually for mid-sized chemical plants. Real-time Statistical Process Control (SPC) tools allow manufacturers to detect process drift early, reducing waste and improving responsiveness. A manufacturer processing 400,000 parts/year with a 4% scrap rate loses $160,000 annually. Reducing batch variability by 25–50% could save $40,000–$80,000 annually, depending on material costs and the extent of process improvement.
- $500K–$1M annually: batch manufacturing losses due to variability in mid-sized chemical plants
- $160K annually: losses from a 4% scrap rate at 400,000 parts/year
- $40K–$80K annually: savings by reducing batch variability by 25–50% with SPC
Ensuring Precision in Intraocular Lens Injection Systems
Challenge
In cataract surgery, lenses are now often implanted using an intraocular lens injection system rather than forceps. The organization designed a syringe-like injector preloaded with the lens, allowing surgeons to use an automated implant mechanism. The force applied by the syringe must be carefully controlled to avoid damage.
Products
Minitab Statistical Software, Minitab Engage
Solutions
The organization followed a DMAIC process when developing the new injector. Several tools including t-tests were used to evaluate statistical differences in injector pressure between the old and new design.
Additionally, a two proportions test demonstrated that the proportion defective was reduced with the new design.
Results
The organization gained a better understanding of the performance of their new devices, ensuring they meet the necessary parameters. This confidence in their process and data continues to allow them to develop new and improved products.
In addition to these qualitative benefits, research on preloaded intraocular lens (IOL) injector systems shows measurable, tangible outcomes: surgeries save 30 seconds to over 1 minute per case, which compounds into 5–8% more throughput annually, equating to up to 1,440 additional surgeries per year. These efficiencies generate $284,000–$565,000 in additional revenue per facility each year, while also reducing contamination risks by eliminating unnecessary IOL touches and minimizing setup delays.
- 30s–1 min per case saved: time reduction with preloaded intraocular lens (IOL) injector systems
- 5–8% more throughput annually: up to 1,440 additional surgeries per year
- $284K–$565K annually: additional revenue per facility from efficiency gains
- Reduced contamination risk: fewer IOL touches and setup delays, improving patient safety and efficiency
Automated Drug Stability Testing
Challenge
A stability test evaluates how a drug or product maintains its potency, purity, and quality over time under various conditions like temperature, humidity, and light. Scientists in the pharmaceutical industry use these tests to determine product shelf life as well as to guide proper storage, handling, and labeling instructions. Because the same tests are run on many variables across multiple batches and lots at multiple time points, automating this work is key to efficiency.
Products
Minitab Statistical Software, Minitab Connect
Solution
Minitab Connect was configured to automatically read the latest data, manipulate it for analysis, run a stability study using Minitab Statistical Software, and report results back to the Connect Dashboard where the results could be shared with the US FDA.
Results
The time to generate each FDA stability report has dropped from several hours to fully automated, enabling immediate updates whenever new data becomes available. Industry-wide, such automation typically leads to a 40%–90% reduction in manual data entry errors, as well as a 40%+ increase in productivity thus freeing analysts to focus on higher-value tasks rather than repetitive reporting. Stability software also helps ensure strong regulatory compliance, maintains data integrity through audit trails, and delivers consistently formatted, submission-ready reports, minimizing risks of non-compliance or data integrity issues.
- Several hours to automated: time to generate each FDA stability report reduced to real time
- 40%–90% reduction: fewer manual data entry errors through automation
- 40%+ increase: productivity gain, freeing analysts for higher-value work
- Reduced compliance risk: submission-ready reports and audit trails minimize costly errors
Bottling Plant Quality Improvement
Challenge
A bottling plant Quality Engineer struggles with inconsistent product quality due to reactive problem-solving. Issues like fill levels that are too low or too high, misaligned labels, and inconsistent carbonation are often identified after significant scrap and rework have occurred, leading to lost time and money. Outdated reports and manual data compilation hinder timely identification of root causes.
Products
Minitab Statistical Software, Minitab Real-Time SPC and Minitab Prolink
Solution
Minitab Real-Time SPC and Prolink provides instant visibility into production data, enabling the Quality Engineer to detect deviations in fill levels, carbonation, and capping processes in real time. Control charts alert to shifts and trends, allowing for proactive intervention before defects accumulate. Integrated with Minitab Statistical Software, the Quality Engineer can perform advanced analysis directly from the Real-Time SPC dashboard.
Results
By implementing Minitab SPC solutions, the bottling plant achieved dramatic reductions in scrap and rework, enabling early detection and correction of process deviations. This led to improved fill-level consistency, reduced downtime, and fewer customer complaints, all of which translated into measurable cost savings and enhanced customer satisfaction.
Industry research shows that beverage plants typically lose 1–3% of production to scrap and rework, which can cost $500,000–$1.5M annually for a mid-sized bottling facility producing ~200M bottles per year. Real-time SPC solutions have been shown to cut scrap and rework by 50–90%, reducing escaped defects from 8% to just 0.5%. For a plant with annual scrap costs of $1M, this translates into $500,000–$900,000 in savings per year. In addition, reduced downtime and fewer complaints lower warranty claims and protect brand reputation, further improving financial performance.
- $500K–$1.5M annually: typical scrap and rework losses for a mid-sized bottling plant
- 50%–90% reduction: scrap and rework savings possible with Real-Time SPC
- $500K–$900K annually: savings per year for a plant with $1M scrap costs
- 8% to 0.5%: reduction in escaped defects with real-time monitoring
Reducing Time in the Emergency Department (ED)
Challenge
Reducing time in the Emergency Department (ED) is essential to identify bottlenecks, reduce wait times, improve resource allocation, enhance patient experience, and increase efficiency. Effective management of ED processes is crucial for providing timely care and optimizing the use of healthcare resources.
Products
Minitab Workspace, Minitab Simul8
Solution
The healthcare facility utilized process maps and value stream maps in Minitab Workspace to assist in optimizing healthcare processes, reducing inefficiencies, and mitigating risks. By mapping the process, the facility was able to identify bottlenecks and areas for improvement. Minitab Simul8 was used to simulate future bed availability to reduce backups in the ED. This simulation helped in understanding the impact of various changes and optimizing resource allocation to achieve better performance.
Results
With ongoing cost reductions and other restrictions within the healthcare environment, resources are becoming increasingly precious and scarce. Tools like Simul8 ensure that the highest performance is achieved with the most reasonable allocation of resources. These improvements enhance patient experience and increase overall efficiency in the ED. John Hopkins created an ED simulation at Howard County Hospital, which was then used across the whole system to help in their quest for zero-wait EDs.
This simulation demonstrated a 16% reduction in Length of Stay (LOS) and a significant reduction in wait time from 61.8 minutes to 16.2 minutes. These improvements enabled faster patient flow, reduced wait times, and optimized resource allocation, moving the institution significantly closer to its zero‑wait ED goal. The simulation insights also supported strategic infrastructure decisions, informing capacity planning for a $40 million ED expansion at Bayview Medical Center.
- 16% reduction: decrease in patient Length of Stay (LOS) in the ED
- 61.8 minutes to 16.2 minutes: reduction in average ED wait times
- $40M expansion: simulation insights supported capacity planning for Bayview Medical Center
Reducing Patient Wait Times for Lab Results
Challenge
Reducing patient wait times for lab results is crucial because timely results are essential for accurate diagnosis and effective treatment. Physicians need reliable wait time estimates, but the variability in wait times is excessive, and it takes too long to obtain results. This delay can lead to prolonged patient anxiety, delayed treatment decisions, and overall inefficiency in healthcare delivery.
Products
Minitab Statistical Software, Minitab Simul8
Solution
The diagnostic lab first collected baseline data to evaluate current performance relative to their wait time KPIs. Minitab enabled comprehensive analysis of patient data to identify trends and patterns, aiding in informed decision-making. The Minitab Assistant guided users to the most appropriate statistical analysis, providing results in natural language and performing automatic assumption checks.
To address the challenge, the lab simulated the effect of adding two new diagnostic machines using Minitab Simul8. The simulation determined that the current machines were not working at maximum capacity, and the bottlenecks were caused by not keeping enough “buffer stock” in the lab equipment, rather than a shortage of lab equipment.
Results
By identifying the true cause of the bottlenecks, the hospital avoided unnecessary purchases of additional equipment, saving roughly $45,000. Simple data analysis showed that the hospital was not keeping up with lab requests due to inefficient use of existing resources. Implementing changes based on these insights significantly reduced patient wait times for lab results, improving overall patient care, operational efficiency, and cost savings.
- $45K saved: avoided unnecessary purchase of additional lab equipment
- Reduced wait times: faster lab results through efficient use of existing resources
- Improved operational efficiency: better utilization of equipment and resources without new capital investment
Predictive Maintenance in Oil and Gas
Challenge
An oil and gas company is interested in identifying patterns in variables such as corrosion rate, vibration levels, and pressure that typically precede maintenance events. This allows for early intervention, reducing unplanned downtime and preventing costly equipment failures.
Products
Minitab Statistical Software, Minitab Connect, Predictive Analytics Module
Solution
Automated machine learning in the Predictive Analytics module allows analysts to determine which conditions are likely to lead to an unplanned maintenance issue out in the field. Using Minitab Connect, important variables can be monitored in real time with alerts automatically sent when processes fall out of control.
Results
Predictive maintenance analytics in oil and gas can lead to multi-million-dollar annual savings, increased asset reliability, and safer, more sustainable operations. The cost of unplanned downtime is $100,000–$300,000 per hour for offshore rigs and $20,000–$50,000 per hour for onshore refining units. A predictive model preventing just one major failure can save millions annually by avoiding several hours or days of downtime. Predictive analytics can reduce maintenance costs by 20–30%, translating to $1–$3 million annually for a large refinery. Extending the life of critical assets (e.g., compressors, pumps) by even 1–2 years can save $500,000–$2 million per asset. Avoiding one major incident can prevent $10 million or more in fines, cleanup, and reputational damage.
- $100K–$300K per hour: cost of unplanned downtime on offshore rigs
- $20K–$50K per hour: cost of unplanned downtime on onshore refining units
- $1M–$3M annually: maintenance cost savings for a large refinery (20–30% reduction)
- $500K–$2M per asset: savings from extending life of critical equipment by 1–2 years
- $10M+ avoided: fines, cleanup, and reputational damage prevented by avoiding one major incident
Increasing ATM Traffic
Challenge
Improving the customer experience at ATMs is known to increase usage, result in higher customer satisfaction, and improve financial performance for a bank. Analysts want to determine whether installing surrounds around the bank’s ATMs will increase their traffic.
Products
Minitab Statistical Software, Minitab Engage
Solution
Minitab Engage tracks the progress and financial benefits of continuous improvement (CI) projects throughout the organization. Minitab Assistant helps analysts determine the correct tool for analyzing ATM data and provides results in natural language for better understanding of conclusions.
Results
By implementing ATM surrounds, the bank achieved a measurable increase in traffic, customer satisfaction, and financial performance. Industry case studies show that ATM usage can increase by 20–30% with surrounds. For a bank operating 200 ATMs, each averaging 3,000 monthly transactions, this translates to approximately 150,000 additional transactions per month. At the 2025 average out-of-network ATM fee of $4.77 per transaction, this usage lift equates to about $715,500 in incremental fee revenue per month, or $8.6 million annually.
In addition to new fee revenue, the shift of transactions from tellers to ATMs generates significant labor savings. If just 5% of additional ATM transactions (7,500 per month) replace teller visits, and each teller transaction costs banks an average of $4 in labor, the bank saves around $30,000 per month, or $360,000 annually. Together, these outcomes demonstrate that surrounds are not just a customer-experience improvement but also a strong financial investment, with millions in revenue growth and hundreds of thousands in cost savings each year.
- 20%–30% increase: ATM usage uplift with surrounds
- 150K additional transactions per month: from 200 ATMs averaging 3,000 transactions each
- $715K per month / $8.6M annually: incremental ATM fee revenue at $4.77 per transaction
- $30K per month / $360K annually: labor savings from teller transaction replacement
포인트 솔루션을 넘어, 완전한 성과로














포춘 100대 기업의 90% 이상이 신뢰하는 Minitab
50년 이상 동안 Minitab은 산업, 규모, 지역을 넘어 전 세계 다양한 기업으로부터 변함없는 신뢰를 얻어왔습니다. Minitab을 선택한 고객들의 공통된 목표는 단 하나, 탁월함에 대한 확고한 의지입니다. Minitab은 그들이 그 목표를 달성할 수 있도록 지속적으로 함께 끝까지 지원합니다.










고객 목소리로 확인하는 성과
효율성 향상부터 재무적 임팩트까지, 기업들은 Minitab이 의미 있는 성과를 어떻게 만들어내는지를 지속적으로 공유하고 있습니다.

Shaik C.
Data Analyst | G2

Minitab Connect는 정말 강력한 플랫폼입니다!
Excel 시트, SQL 데이터베이스, 클라우드 플랫폼은 물론 IoT 디바이스까지 다양한 데이터 소스를 하나의 작업 공간으로 통합해 주는 ‘데이터의 만능 번역기’ 같아요. 이런 뛰어난 연결성 덕분에 데이터 정리가 놀랄 만큼 매끄럽고 우아하게 느껴집니다.
Daniel P.
LSS Black Belt and APEX Deployment Leader | G2

Minitab Engage는 매우 직관적이고 사용하기 쉬운 플랫폼입니다.
학습과 탐색이 간편해 누구나 빠르게 익힐 수 있어요. Idea, Hopper, Active 등 주요 단계로 구성된 간단한 탐색 구조를 통해 프로젝트 파이프라인을 효율적으로 관리할 수 있습니다. 또한 필터와 정렬 기능의 자유도가 높아 원하는 프로젝트를 빠르고 효과적으로 찾을 수 있습니다.

Kristina N.
Industrial Engineer II | Capterra
.png)
사용 편의성과 훌륭한 고객 경험까지 정말 만족스럽습니다!
10점 만점에 10점, 다시 구매할 의향이 확실히 있어요. 고객 지원 담당자와 함께 진행한 교육도 수강했는데, 단순히 제품만 구매해 사용하는 것보다 툴 활용도가 훨씬 높아졌습니다. 제가 가장 자주 소통하는 두 분의 담당자 모두 정말 훌륭했고, 고객이자 사용자로서의 경험에 대해 긍정적인 말만 나올 정도입니다. 제품은 물론, 고객의 의사결정을 진심으로 돕고자 하는 태도가 느껴져 더욱 신뢰가 갔습니다.
Joel D.
Lean Specialist | Capterra
필수 플랫폼입니다.
소규모 JDI부터 카이젠 이벤트, 장기간의 DMAIC 프로젝트까지 프로젝트 관리에 필요한 모든 도구를 한 곳에서 사용할 수 있다는 점이 정말 편리합니다. 시간 측정 데이터, 프로세스 흐름도, VSM 등 다양한 요소를 통합해 관리할 수 있어요. 또한 부서 간 업무 균형을 맞추기 위해 야마즈미 차트 템플릿을 직접 생성할 수도 있었습니다.
Patrik T.
Application Specialist | Capterra
Simul8로는 거의 모든 것을 구축하고 시뮬레이션할 수 있습니다.
기본 기능은 쉽게 배워 간단한 시뮬레이션을 빠르게 만들 수 있으면서도, 소프트웨어의 깊이가 매우 뛰어나 사실상 구현하고 시뮬레이션하지 못할 것은 없다고 느꼈습니다.
Verified User
Manufacturing

품질 관리와 프로세스 개선에 꼭 필요한 툴입니다.
Minitab은 복잡한 데이터 분석을 간소화해 주는 훌륭한 통계 소프트웨어입니다. 직관적인 인터페이스 덕분에 초보자도 쉽게 사용할 수 있고, 숙련된 사용자는 회귀분석, ANOVA, 관리도 등 강력한 고급 기능을 활용할 수 있습니다. 또한 Six Sigma와 Lean 같은 품질 개선 방법론과의 뛰어난 연계성이 특히 인상적이었습니다. 전반적으로 품질 관리와 데이터 기반 의사결정을 중요하게 생각하는 분이라면 반드시 갖춰야 할 도구입니다.
Gerald B.
Health, Wellness and Fitness Owner | G2
효율적인 데이터 변환과 자동화
코딩 지식이 없어도 데이터를 자유롭게 수정할 수 있는 훌륭한 인터페이스가 인상적입니다. Minitab Connect를 통해 데이터 리포팅을 자동화할 수 있어 업무 속도가 크게 향상되었습니다. 또한 프로세스를 간소화하고 과소·과다 충전과 같은 오류를 줄이는 데 도움을 주어, 그 결과 회사의 생산 비용 절감에도 기여하고 있습니다. 시각적으로 보기 좋고 전문적인 차트를 설계할 수 있는 강력한 도구를 제공해 데이터 분석 역량도 한층 높여줍니다.
Tommy H.
Continuous Improvement Engineer
Minitab, 20년이 지난 지금도 여전히 만족하며 사용 중입니다.
저는 2004년에 품질 테스트 데이터를 Excel로 박스플롯으로 만들다가 어려움을 겪은 뒤 Minitab을 처음 접했습니다. 당시 제 매니저가 Six Sigma 교육을 막 수료하고 Minitab을 소개해 줬는데, 스스로 익히며 평균값 위주의 분석보다 훨씬 의미 있는 품질 데이터 박스플롯을 만들 수 있었습니다. 그 이후 직무와 근무지가 바뀌는 동안에도 가설 검정, 관리도 작성, ANOVA 분석 등을 활용해 공정 변화와 공정 특성의 변화를 파악해 왔습니다. Minitab은 통계를 정말 쉽게 만들어 주는 도구입니다!
Minitab과 함께 다음 단계로 나아가세요.
다음 단계를 검토 중이든, 지금 바로 시작할 준비가 되었든, Minitab은 귀사의 비즈니스에 꼭 맞는 솔루션을 찾아 다음 단계로 도약할 수 있도록 지원합니다.