USE CASE
Compare process performance and identify factors linked to variation.

Follow five guided steps in Minitab to fit, check, and interpret a model using manufacturing data.
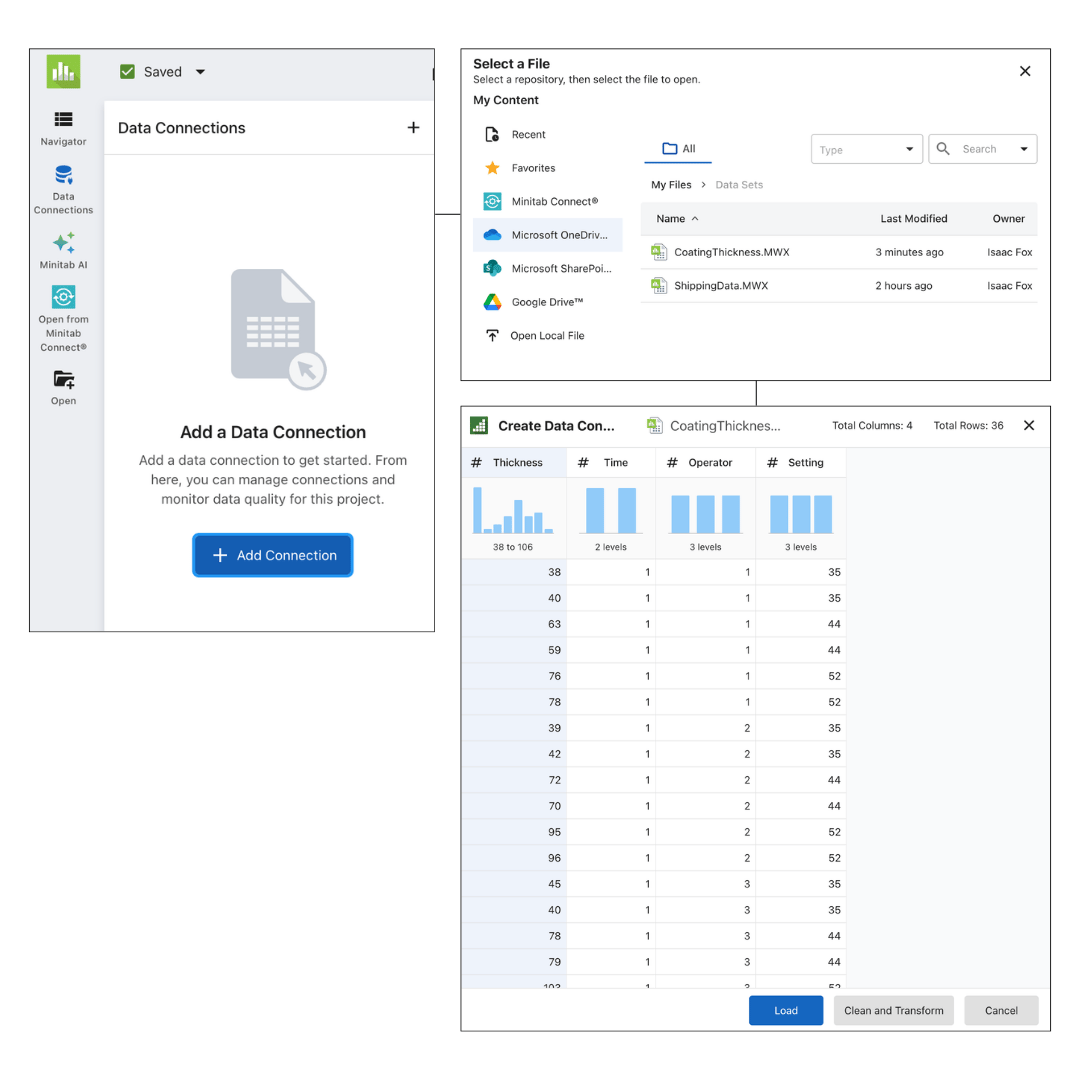
First, download and save CoatingThickness.MWX to your organization’s cloud storage.
From the Minitab Solution Center home page, open Minitab Statistical Software. From the left-hand navigation, select Open and select the CoatingThickness file from your saved location.
Verify that the columns show Thickness, Time, Operator and Setting. Hit Load, and now you’re ready to start finding key factors.
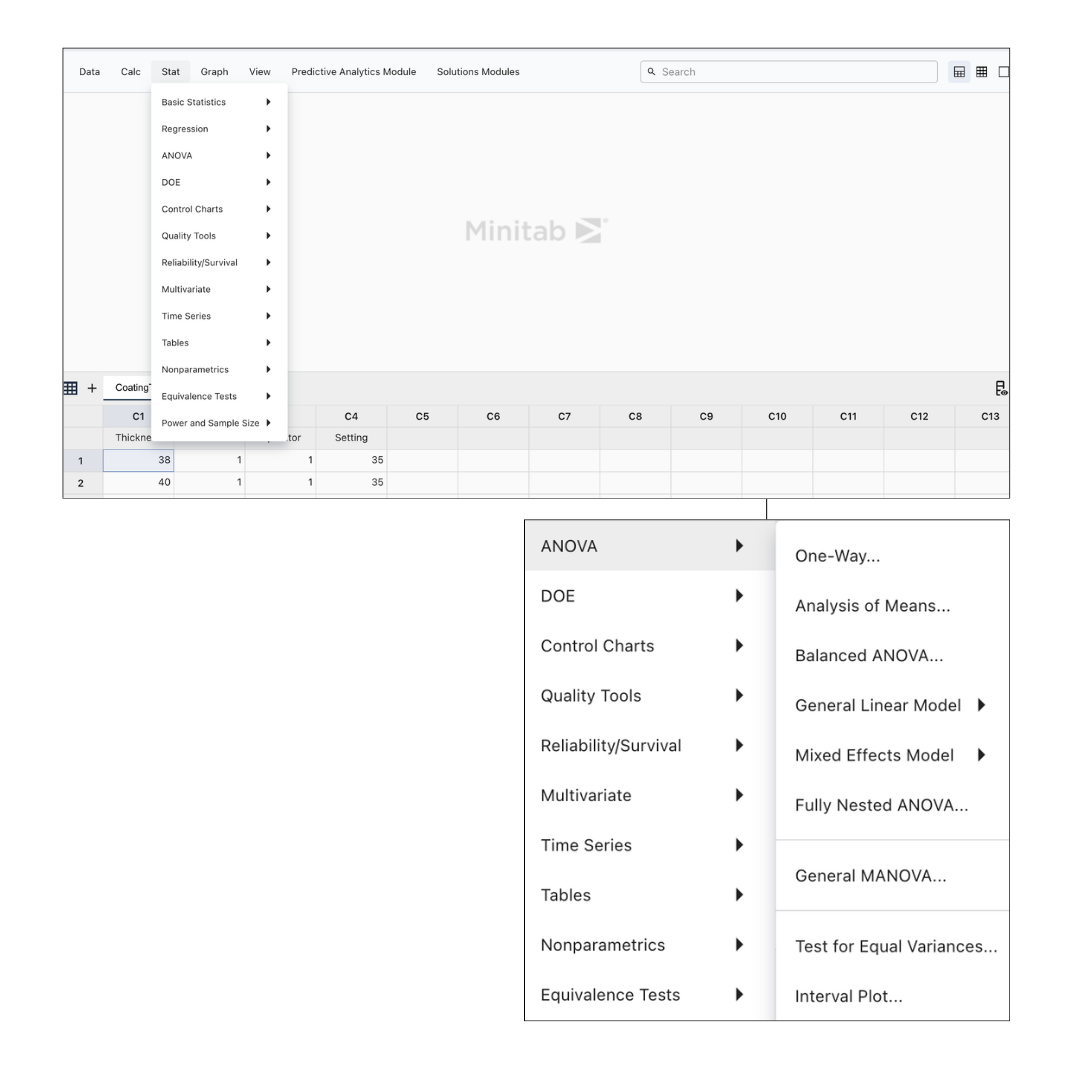
Go to the top ribbon, and navigate to Stat > ANOVA > Balanced Anova. We’re setting up to test which factors explain the output thickness you’re getting—which is crucial for quality improvement.
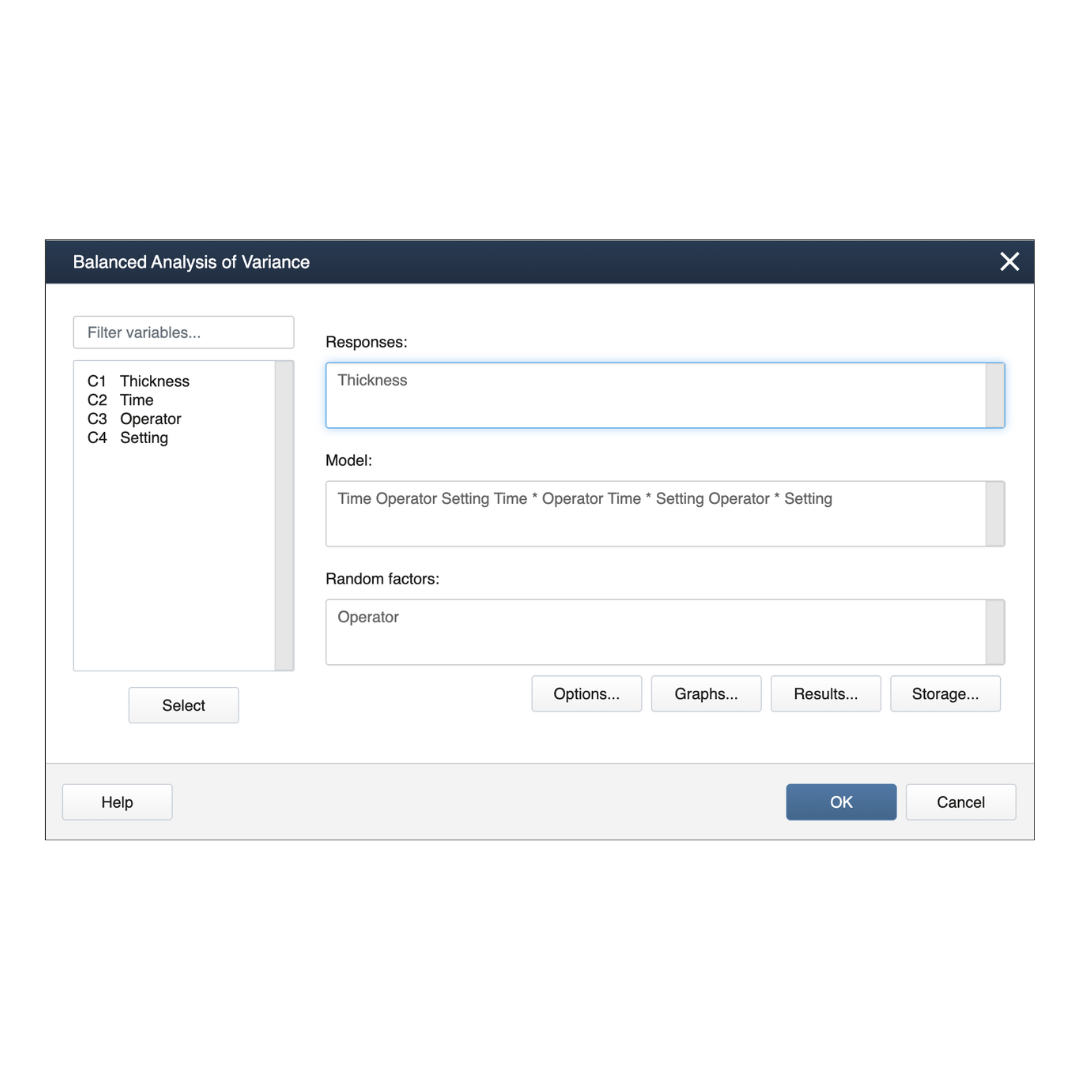
In the Balanced Analysis of Variance dialog, tell Minitab what you want to explain and what might be causing the difference. Set it up as follows:
Responses
Click inside the Responses input box, select Thickness from the list of variables and hit Select.
This is the measurement you are trying to understand.
Model
Paste the following list into the Model input:
TimeOperator Setting Time*Operator Time*Setting Operator*Setting
This tells Minitab to test each factor by itself, plus whether factors work differently together.
Random factors
Click inside the Random factors input box, select Operator from the list of variables and hit Select.
The operators are treated as a sample of possible operators, not the only people who could run the process.
Don't hit OK just yet. We'll keep this dialog open for the next step.
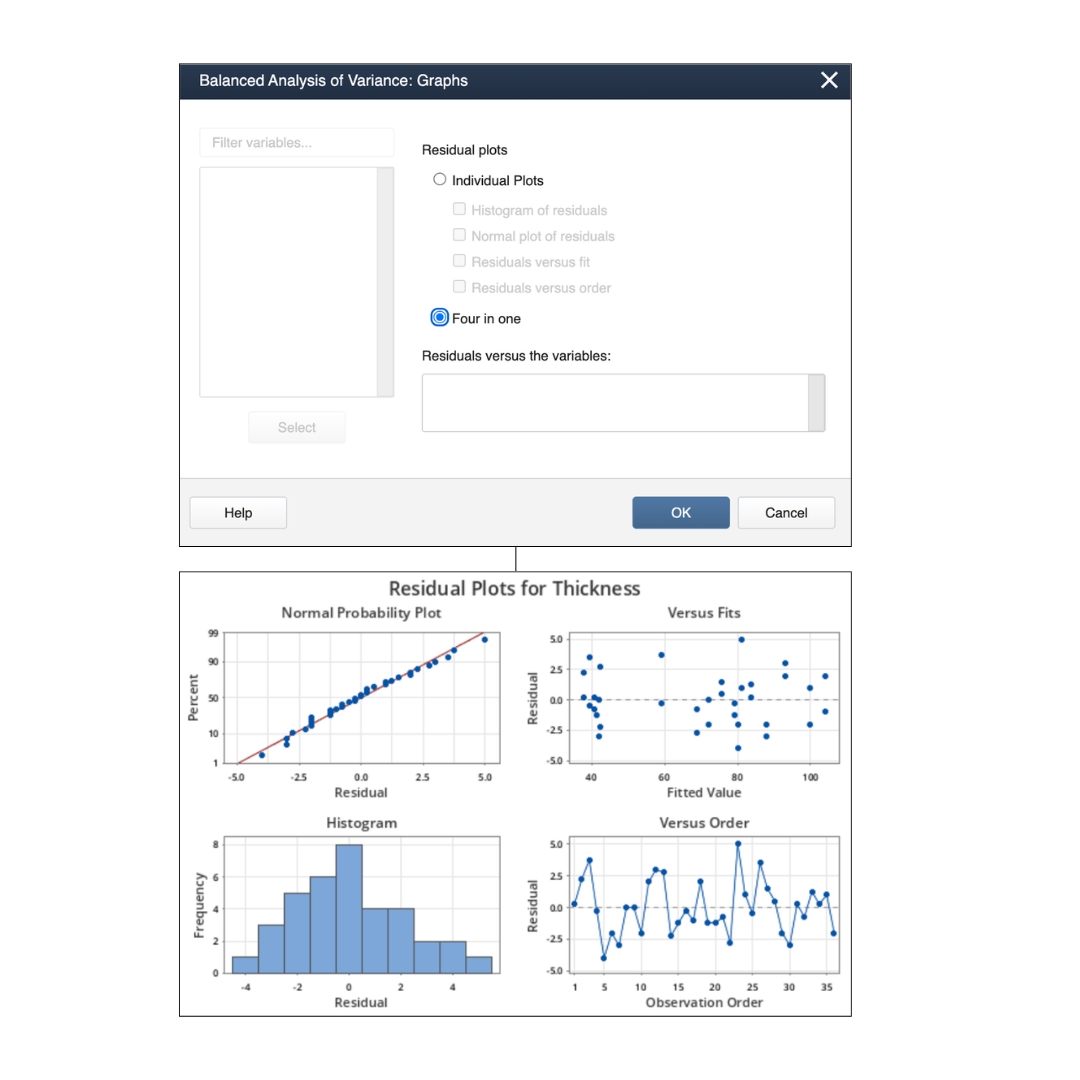
Before hitting OK, click Graphs then select Four-in-one.
Click OK to close the Graphs dialog, then OK again to close the Balanced ANOVA dialog.
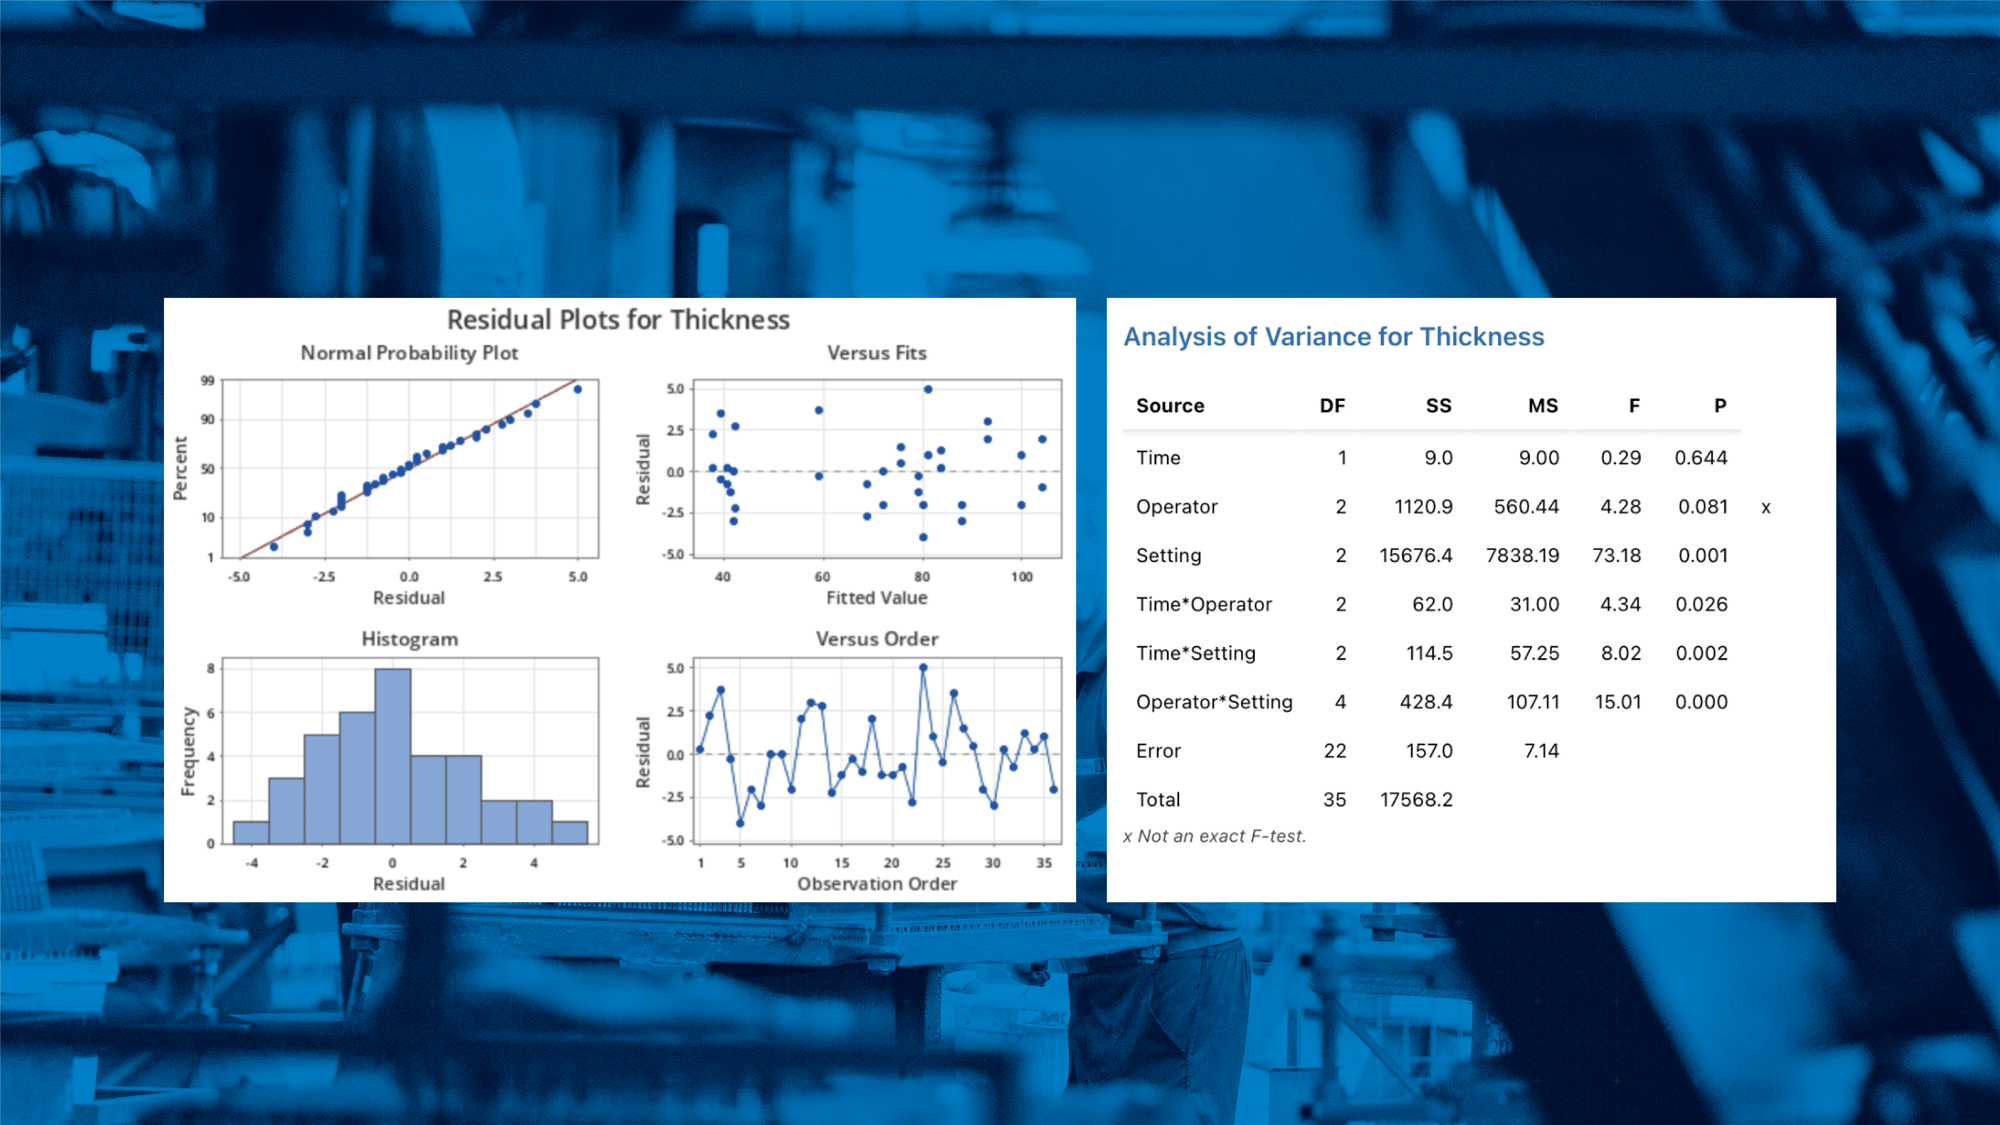
Scroll through the top section of your screen and you'll see a histogram and a normal plot of your residuals, as well as graphs of residuals vs. fit and residuals vs. order.
 Minitab AI
You can use Minitab AI to summarize statistical output, highlight key findings, and explain results in clear, accessible language.
On the top right of your CoatingThickness canvas, click to generate a Minitab AI summary.
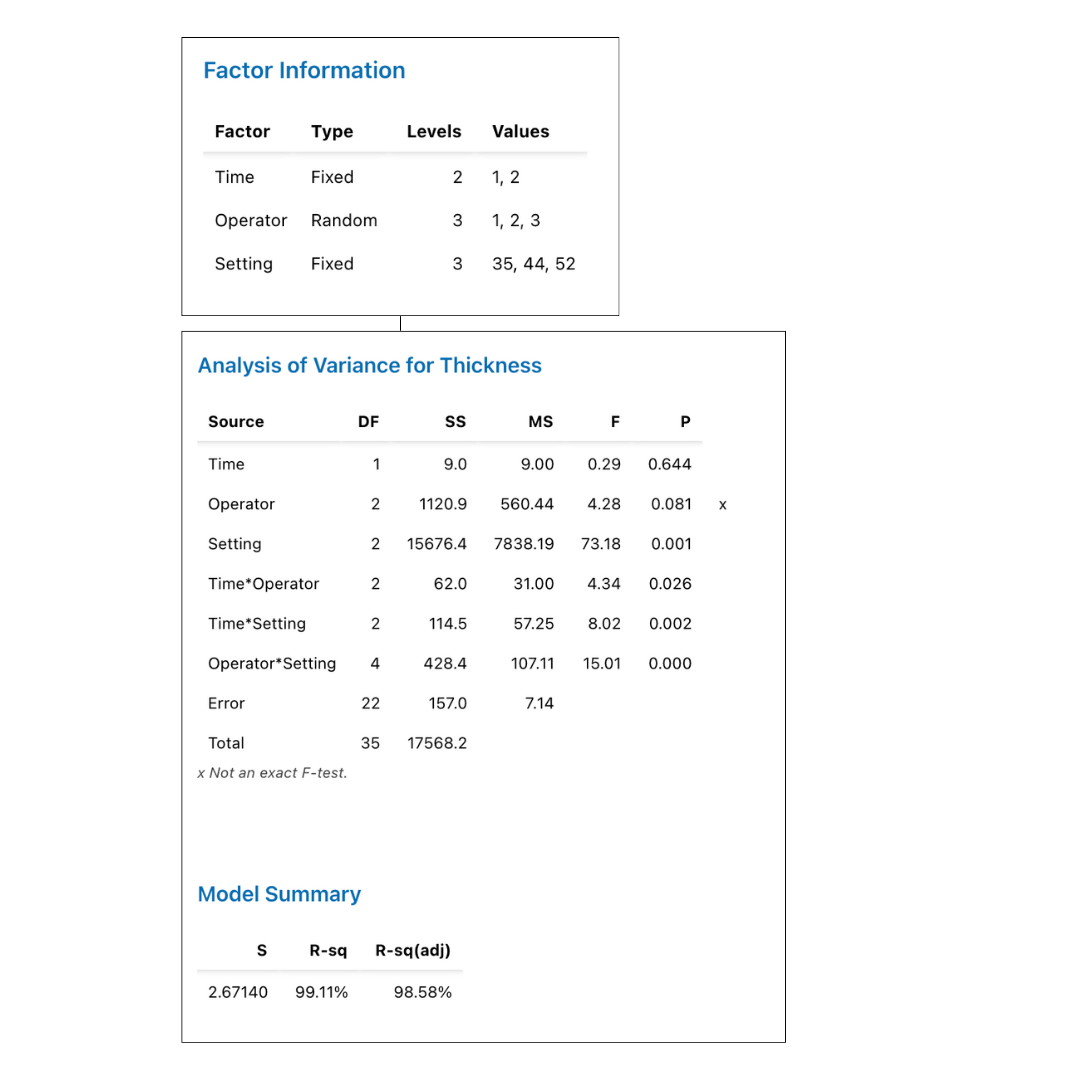
Scrolling back up, the Factor Information table lays out what Minitab tested. In this case, you compared Thickness across 2 time periods, 3 operators, and 3 machine settings.
Then review the P column in the ANOVA table; values below 0.05 suggest a factor contributes meaningfully to variation in coating thickness.
In our dataset, Setting is the clearest driver of thickness, while Time does not appear to matter by itself. Significant interaction terms indicate that the effect of one factor depends on another. For example, the effect of Setting may differ by Operator.
Now you know which factors and interactions appear most important for explaining variation in coating thickness!

Clean your data faster so you can focus on analysis.
Learn more
Make your insights visible across your organization.
Learn more
Get products to market faster with the same confidence.
Learn more
Learn how to predict what will happen next based on current data.
Learn more